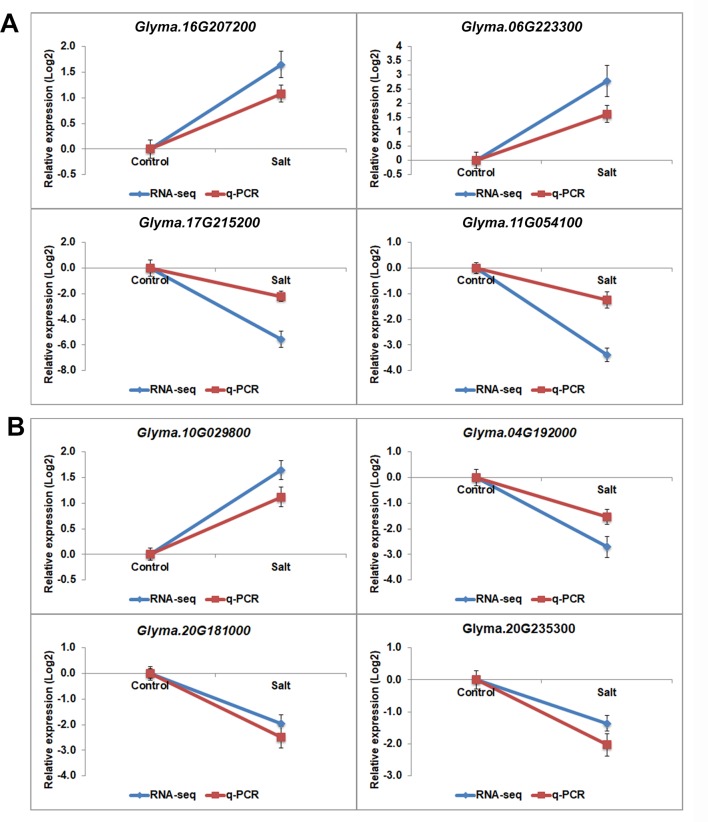
Figure 6.
The gene expression pattern of selected histone modifier genes analyzed by RNA-seq and q-PCR. mRNA expression levels of 4 histone methyltransferases (A) and histone demethylasesgenes (B) with differential expression levels in salt-treated soybean compared to control plants. Graphs show the relative expression levels analyzed by RNA-seq and by qPCR which normalized to a Tubulin (Glyma.05G203800) reference gene. Error bars represent standard deviation (SD).

