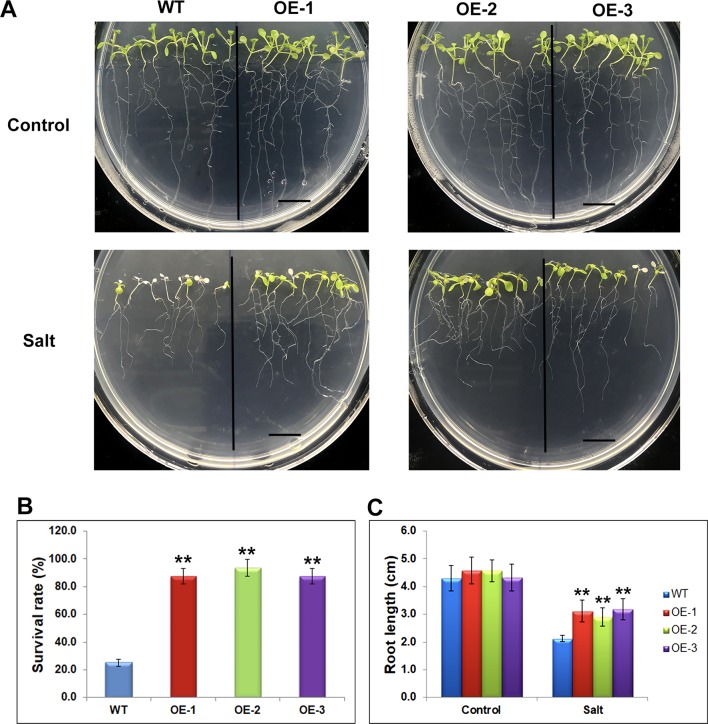
Figure 7.
Phenotypes of Glyma.17g022500 transgenic plants under salt stress. (A) Salt tolerance assay of the Glyma.17g022500 overexpression (OE) lines, OE-1, OE-2, OE-3 plants. WT, OE-1, OE-2 and OE-3 seedlings at 5 DAG were transferred from MS medium to MS medium containing 150 mM salt and grown for an additional 5 days. Bar = 1 cm. (B) Survival rate of the plants in (A) under salt stress. The data presented are the mean ± SD (n = 50). (C) Root length of seedlings grown on medium with and without salt. Root length was measured after 5 days of growth on MS or MS with salt (n = 50). Significant differences from the WT (Student’s t test) are marked with asterisks (**P <0.01).

