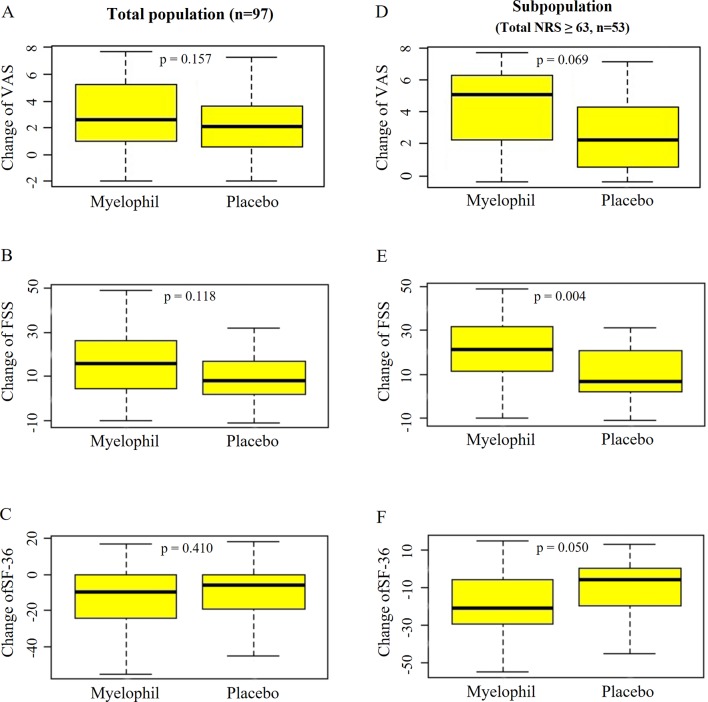
Figure 5.
Changes of VAS, FSS, and SF-36 before and after the treatment. (A) VAS, (B) FSS, and (C) SF-36 in total population. (D) VAS, (E) FSS, and (F) SF-36 in subpopulation with severe fatigue (total NRS ≥ 63). Independent t-test were used for group comparison. VAS, Visual Analogue Scale; FSS, Fatigue Severity Scale; SF-36, 36-item Short-Form Health Survey.

