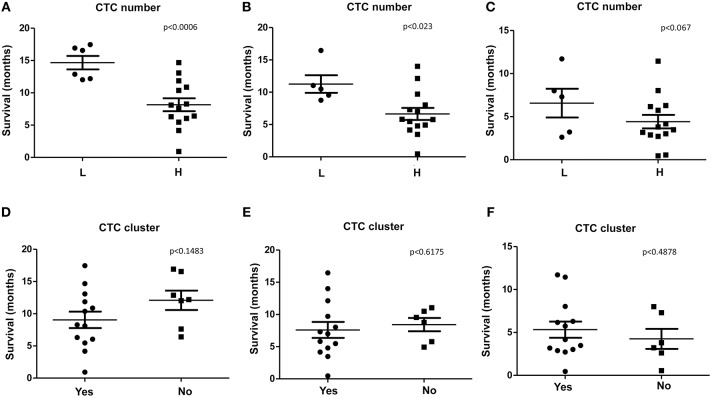
Figure 3.
OS, OS1, and PFS according to CTC or CTC cluster number. (A–C) OS, OS1, and PFS were evaluated stratifying patients according to H (High, more than 10 CTCs/ml) or L (Low, <10 CTCs/ml) CTCs amount. (D–F) OS, OS1, and PFS, were evaluated stratifying patients according to presence (Yes) or not (No) of CTC clusters. p < 0.05 was considered as statistically significant.

