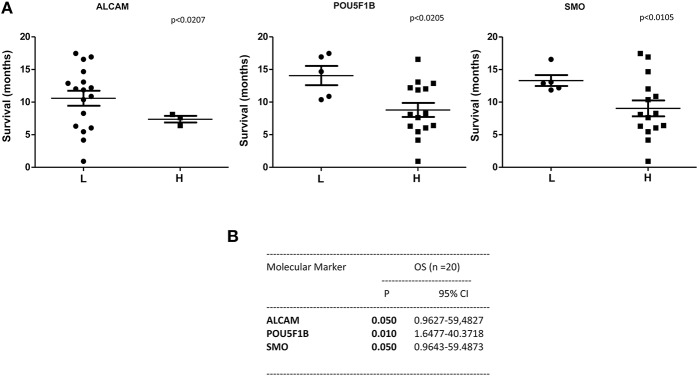
Figure 6.
OS according to gene expression levels in CTCs from PDAC patients before chemotherapy. (A) Patients were stratified according to ALCAM, POU5F1B, and SMO gene expression levels in H (High) and L (Low) expressing. (B) OS evaluated according to the ALCAM, POU5F1B, and SMO gene expression levels by Univariate analysis. p < 0.05 was considered as statistically significant.

