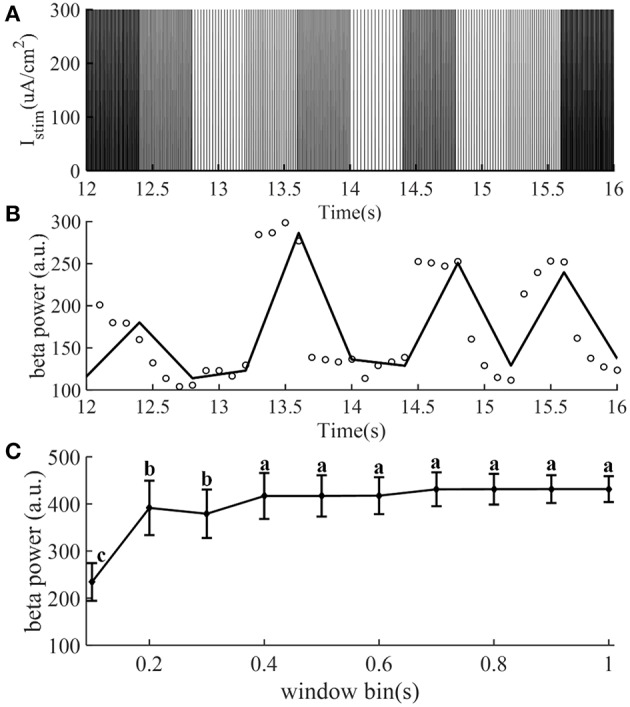
Figure 2.

The stimulation sequence (A) and beta band power (B) obtained from the CTx-BG-Th network model to train the CAR model. Only data from 12 to 16 s are presented to improve visualization. (A) The stimulation frequency was randomly selected from 5 to 200 Hz, and for each frequency the corresponding stimulation sequence lasted for 0.4 s. (B) Circles represent the beta power value in each 0.1 s, the collected beta power within 0.4 s was the average of four values. (C) Mean ± standard deviation of beta power of GPi model neuron spike times plotted as a function of time window bin (50 trials). The mean value of beta power varies across different time window bin values, and values not sharing the same letter were significantly different (p < 0.05, Tukey's HSD).
