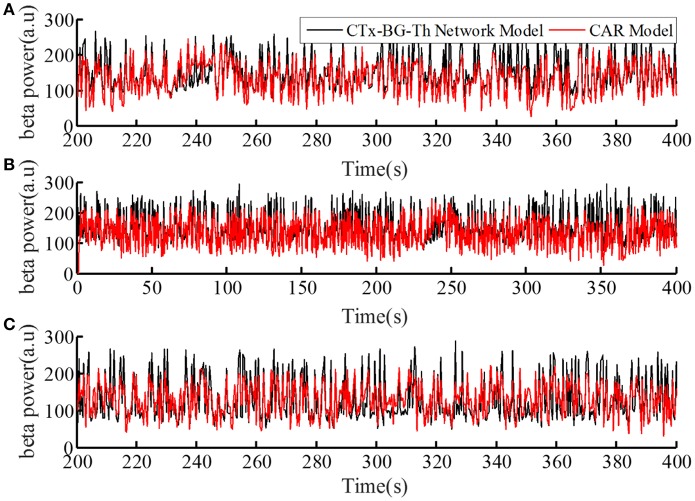
Figure 4.
The prediction performance of the CAR model during model training (A) and testing (B,C). The datasets used to train and test the CAR model were generated as described in section Computational Model of the Cortex-Basal Ganglia-Thalamus Network. The black line represented the beta power calculated from the original CTx-BG-Th network model, and the red line represented the beta power data predicted by the identified CAR model.

