
Figure 3.
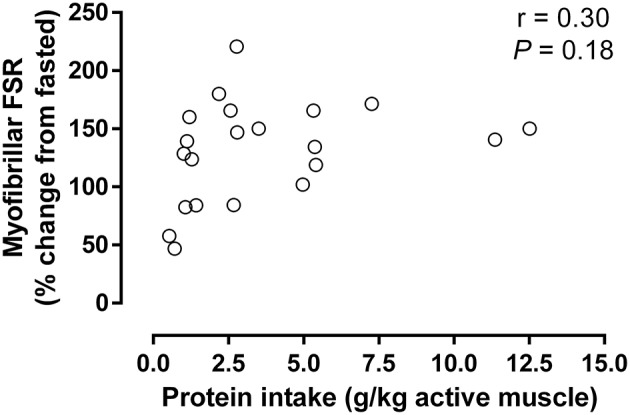
Increase in myofibrillar protein synthesis above control after resistance exercise compared to ingested protein normalized to the estimated active muscle mass (for details, see Table 1). Data were analyzed using a linear correlation (Graphpad Prism V6). Non-significant slope defined by: y = 3.91x + 116 (r = 0.30; P = 0.18; N = 21 as only conditions with protein ingestion were included).