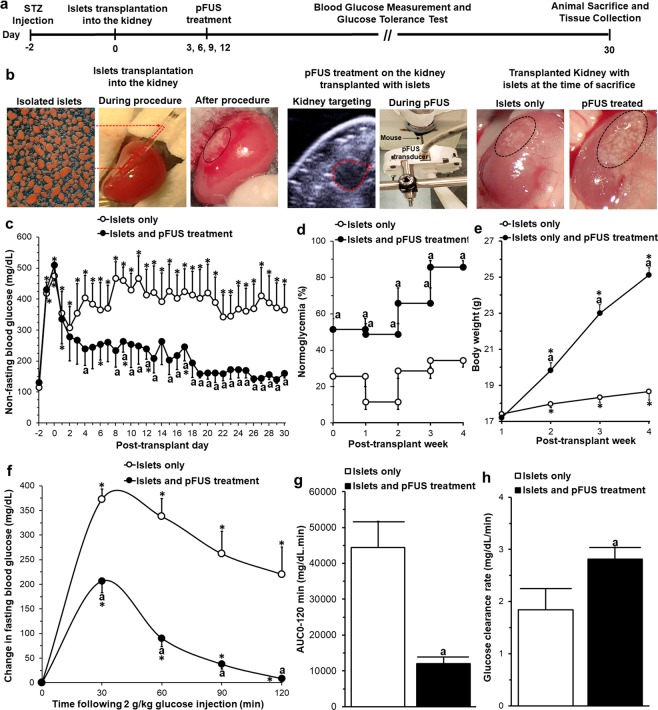
Figure 5.
In vivo analysis following islet transplantation: (a) In vivo experimental details; (b) An example of an islet transplant (both control and islets treated with pFUS) using the kidney sub-capsule space as the site of transplantation: islets before, during and after transplantation (black circle = transplanted islets); pFUS treatment on the kidney containing the transplanted islets (red circle = site of pFUS targeting). Results of (c) blood glucose measurements, (d) normoglycemia percentage, (e) body weight, (f) IPGTT, (g) area under the IPGTT curve (AUC0-120min), and (h) blood glucose clearance rates calculated from the slope of IPGTT curves from 30 to 90 min. Significant differences: (c–h) aP < 0.05: islets only vs. islets treated with pFUS; *P < 0.05: baseline vs. all other time-points (Two (c,e,f) or one (b)-way ANOVA with post-hoc Tukey Test or unpaired Student’s t-test (g,h)).

