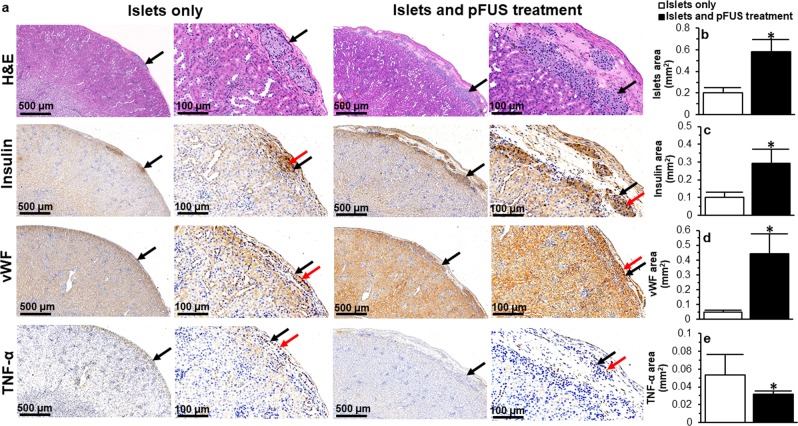
Figure 6.
Histological assessment of transplanted islets: (a) Representative images following H&E, insulin, vWF and TNF-α immunohistochemical staining of islets that were transplanted under the kidney capsule. Black arrows = islets; Red arrow = positive (dark brown) staining; (b) Quantification of the surface area occupied by islets; (c–e) Quantification of positive (c) insulin, (d) vWF and (e) TNF-α staining. For all figures, control samples (non-treated islets) are compared to islets treated with pFUS. Significant differences: *P < 0.05 for islets only vs. islets treated with pFUS (Student’s unpaired t-test).

