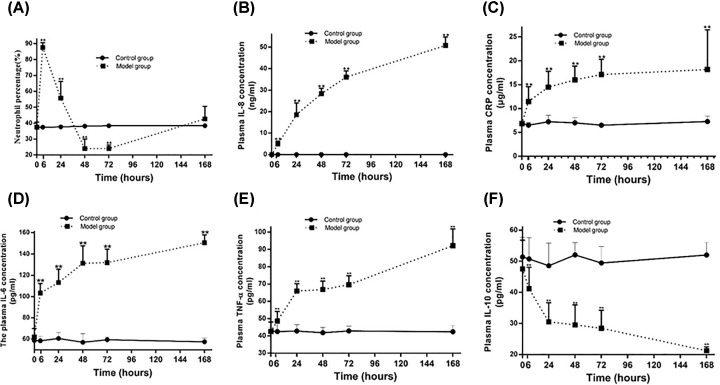
Figure 4. Changes of neutrophil percentage and cytokines in MRSA-infected rabbits.
(A) The change of neutrophil percentage. (B) The change of IL-8 in the model group. (C) The change of CRP in the model group. (D) The change of IL-6 in the model group. (E) The change of TNF-α in the model group. (F) The change of plasma IL-10 in the model group. **P<0.01 model group vs control group.

