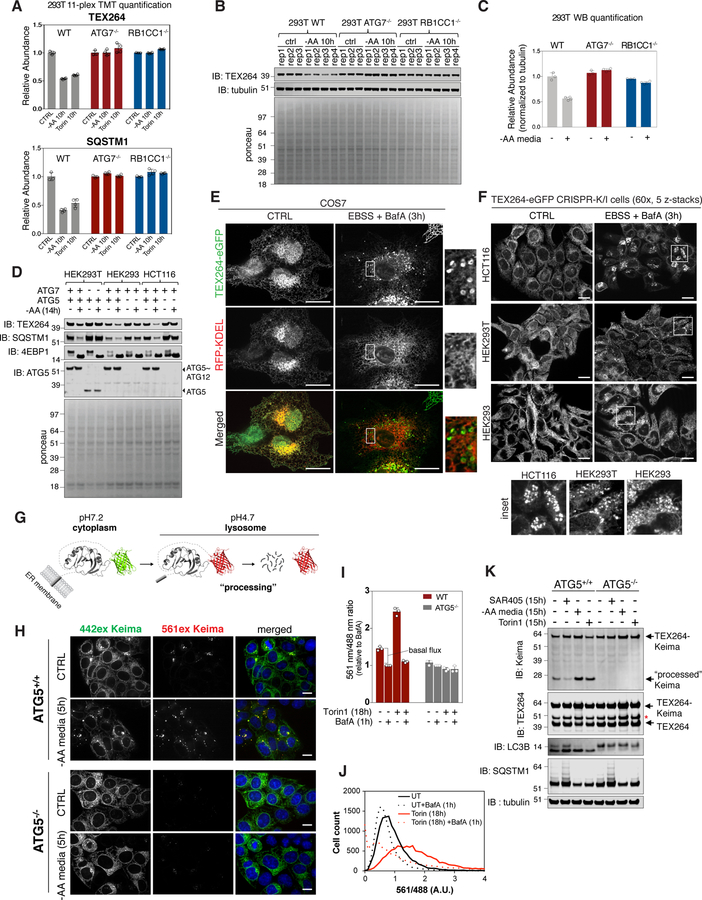
Figure 2. TEX264 is a resident ER protein that is degraded by autophagy in response to nutrient deprivation.
(A) TMT based quantification of TEX264 and SQSTM1 abundance in 293T cells in response to AA withdrawal (10h) or MTOR inhibition with Torin1 (10h). Data are derived from Table S1. Data are represented as mean ± SD for triplicate or quadruplicate measurements.
(B, C) The indicated 293T cells were either left untreated of subjected to AA withdrawal (10h) prior to immunoblotting of cell extracts using the indicated antibodies (panel B). Equal loading of extracts is demonstrated by Ponceau S staining. Data are represented as mean ± SD for triplicate or quadruplicate measurements.
(D) The indicated 293T, 293, or HCT116 cells were either left untreated of subjected to AA withdrawal (14h) prior to immunoblotting of cell extracts using the indicated antibodies.
(E, F) COS7 cells expressing TEX264-eGFP and RFP-KDEL (panel E) or the indicated cells gene edited to express endogenous TEX264-eGFP (panel F) were either left untreated or subjected to nutrient deprivation (EBSS and BafA, 3h) prior to confocal microscopy. Scale bar in panel E = 20 µm, in panel F = 10 µm.
(G) Schematic displaying of the properties of Keima that allow it to be used to monitor flux into the lysosome, where the acidic environment causes an increase in the ratio of 561 nm/488 nm excitation. Once in the lysosome, the Keima fusion protein is “processed” to degrade the fusion protein, but the Keima fragment is resistant to lysosomal proteases and maintains its fluorescence within the lysosome.
(H) TEX264-Keima was stably expressed in HCT116 cells with or without ATG5 and sorted by flow-cytometry for equal expression. The cells left untreated or subjected to AA withdrawal (5h) prior to live cell imaging by confocal microscopy. Scale bar = 10 µm.
(I,J) Stable HCT116 cells prepared as in panel H were left untreated or subjected to Torin1 (18h) with or without BafA (added 1h before analysis) prior to analysis by flow cytometry to measure the ratio of 561 nm/488 nm excitation in single cells (panel I). A plot of cell count versus fluorescence ration for 561/488 nm is shown in panel J. Data are represented as mean ± SD for triplicate measurements.
(K) TEX264-Keima was stably expressed in HCT116 cells with or without ATG5 and cells left untreated or subjected to SAR405, Torin1 or AA withdrawal (15h). Cell extracts were subjected to immunoblotting with the indicated antibodies. The position of processed Keima is shown. Asterisk (red) indicates a band resulting from N-acyl group hydrolysis in Keima chromophore during denaturation, leading to a loss of C-terminus amino acids (18.3 kDa) from intact TEX264-Keima as reported in (An and Harper, 2018). See also Figure S2.

