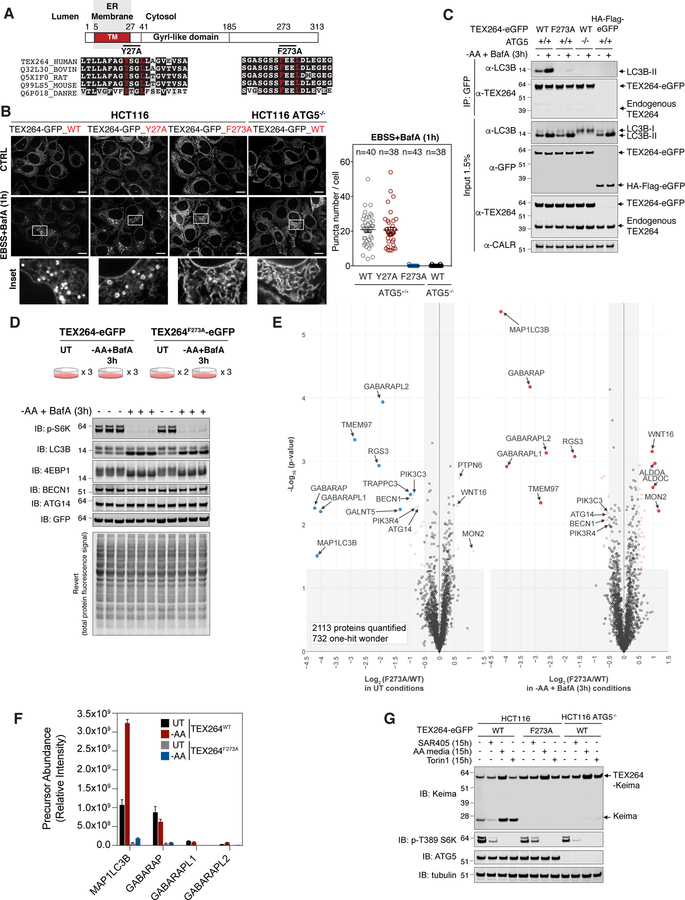
Figure 3. TEX264 associates with specific ATG8 family members and is targeted for autophagy through a C-terminal LIR motif.
(A) Domain structure of TEX264 showing the transmembrane segment, the GyrI-like domain, and the position of two candidate LIR motifs. The sequences on individual LIR motifs are shown below.
(B) The indicated TEX264-eGFP proteins were expressed in HCT116 cells with or without ATG5 and cells either left untreated or treated with EBSS and BafA (1h) prior to imaging by confocal microscopy. Quantification of TEX264-GFP puncta number per cell after starvation is shown in the right panel. Data are represented as mean ± SEM. Scale bar = 10 µm.
(C) Lysates from the indicated HCT116 cells with or without ATG5 stably expressing the indicated TEX264-eGFP protein or HA-FLAG-eGFP as a control were subjected to immunoprecipitation with α-GFP antibodies. Immune complexes or whole cell lysates were subjected to immunoblotting with the indicated antibodies.
(D) HCT116 TEX264−/− cells were reconstituted with WT or mutant TEX264-eGFP at near endogenous levels followed by clonal selection. Cells were left untreated or subjected to AA withdrawal in the presence of BafA (3h) in duplicate or triplicate and extracts subjected to immunoblotting with the indicated antibodies.
(E) Cells from panel D were subjected to α-GFP immunoprecipitation prior to analysis by TMT-MS3. Volcano plots of -Log10(p-value) versus Log2(TEX264F273A/WT) in either untreated conditions or upon AA withdrawal in the presence of BafA (3h) are shown. Proteins with Log2(TEX264F273A/WT ) < −0.5 or > 0.5 (p-value <0.05) are indicated as colored empty circles, and filled colored circles indicate statistically significant hits (Welch’s t-test (S0 = 0.585), corrected for multiple comparison by permutation-based FDR (5%))
(F) Label-free quantification of MS1 precursor ions present in α-GFP immune complexes from panel D (relative intensity). Data are represented as mean ± SD (n=2 or 3, as shown in panel D).
(G) The indicated cells were subjected to SAR405 treatment, AA withdrawal or Torin1 treatment for the indicated times and cell extracts subjected to immunoblotting with the indicated antibodies. See also Figure S3 and Table S2.

