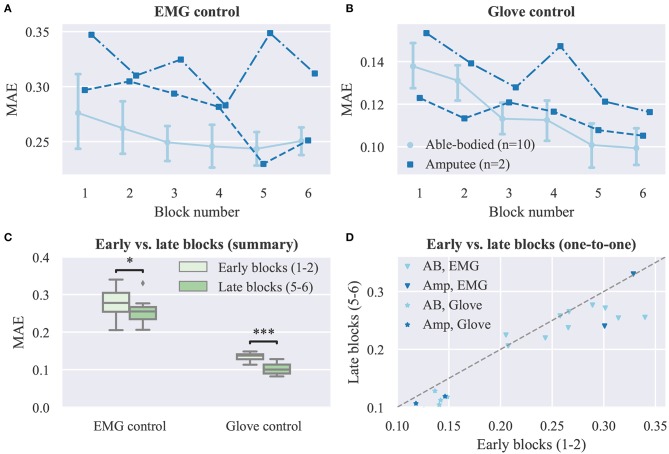
Figure 5.
Effect of user practice on task performance (real-time experiment). (A,B) MAE scores are plotted against the experimental block number for (A) EMG and (B) glove control (note different y axis scales). Data for able-bodied participants are presented as means with confidence intervals. Amputee data are shown separately for each of the two individuals. (C) Comparison of early vs. late blocks for grouped participants (able-bodied and amputee). Each block lasted 3 min and participants were given a 1 min rest after block 3, therefore blocks 1 and 5 were ~13 min apart. Data shown correspond to subject averages across blocks for all participants (i.e., 10 able-bodied and two amputees). Within each block, participants replicated 18 hand postures presented to them exactly once in a pseudo-randomized order. (D) One-to-one comparisons of early vs. late block averages for all participants. Each point in the scatter plot corresponds to a single participant and control mode. Points, means; error bars, 95% confidence intervals estimated via bootstrapping (1,000 iterations); *p < 0.05; ***p < 0.001.

