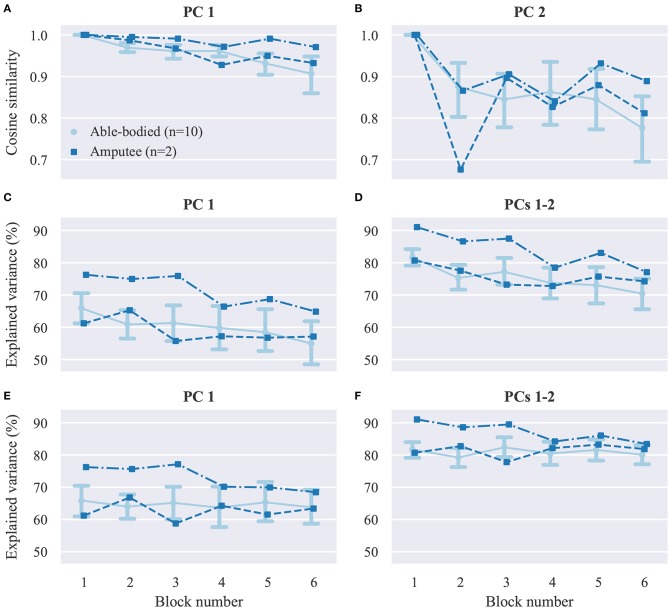
Figure 6.
Dimensionality reduction analysis. (A,B) Average cosine similarities between (A) first (B) and second PCs in each block with the respective PCs computed in block 1. (C,D) Percentage of explained variance in each block by the (C) first and (D) first two PCs computed in block 1. (E,F) Percentage of explained variance in each block by (E) first and (F) first two PCs computed in the same block. PC, principal component. Data for able-bodied participants are presented as means with confidence intervals. Amputee data are shown separately for each of the two individuals.

