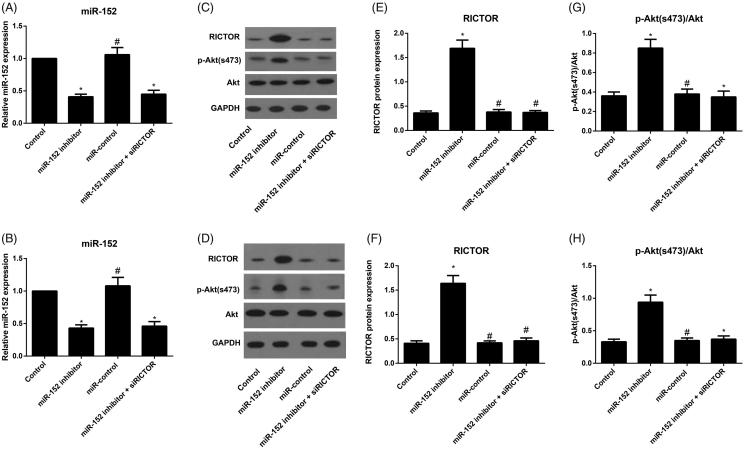
Figure 6.
Comparison of expressions of miR-152, RICTOR and downstream proteins in osteoblasts from each group. Note: A–B, The expression of miR-152 in primary osteoblasts (A) and MC3T3-E1 cells (B) detected by qRT-PCR; C–D, The expression of RICTOR and p-Akt (s473)/Akt in primary osteoblasts (C) and MC3T3-E1 cells (D) evaluated by Western blot; E-F, The expression of RICTOR in primary osteoblasts (E) and MC3T3-E1 cells (F) in each group; G–H, Comparison of p-Akt(s473)/Akt levels in primary osteoblasts (G) and MC3T3-E1 cells (H) among groups; *p< 0.05 compared with Control group; #p< 0.05 compared with miR-152 inhibitor group.

