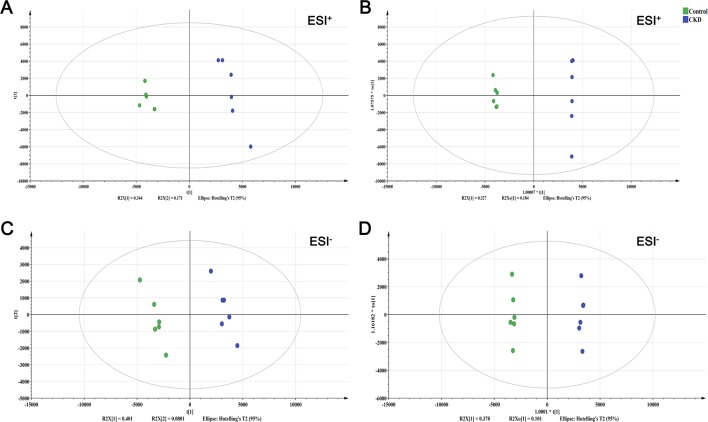
Figure 3.
The score plots from PCA and OPLS-DA model. (A) PCA-X score plot of positive ion mode. (B) OPLS-DA score plot of positive ion mode. (C) PCA-X score plot of negative ion mode. (D) OPLS-DA score plot of negative ion mode. ESI+ means the positive electrospray ionization. ESI− means the negative electrospray ionization. Green circle corresponds to the control group; blue circle corresponds to the CKD group.

