Figure 1.
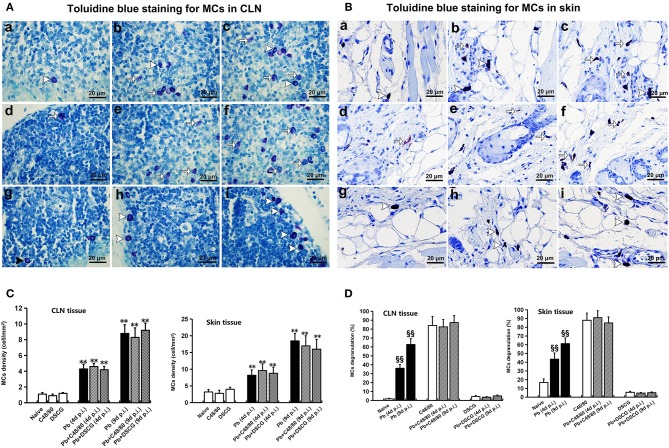
The number of MCs and percentage of MCs degranulation in CLN or skin from PbANKA-infected mice with C48/80 or DSCG treatment. (A,B) MCs were evaluated by toluidine blue staining in CLN (magnification, x400) or skin (magnification, x400) from the uninfected mice treated with saline (a), C48/80 (d), or DSCG (g), and the infected mice treated with saline (b), C48/80 (e), or DSCG (h) at 4 days p.i, respectively; infected mice treated with saline (c), C48/80 (f), or DSCG (i) at 9 days p.i., respectively; Intact MCs (arrowheads); Degranulated MCs (arrows). (C) The density of MCs in CLN or skin tissue were analyzed from different groups by using Student's t-test. *P < 0.05 and **P < 0.01 vs. the Naive mice, #P < 0.05 and ##P < 0.01 vs. the infected controls at 4 days p.i., &P < 0.05 and &&P < 0.01 vs. the infected controls at 9 days p.i.; (D) the level of degranulated MCs in CLN or skin tissue were analyzed from different groups by using Student's t-test. §P < 0.05 and §§P < 0.01 vs. the Naive mice, $P < 0.05 and $$P < 0.01 vs. the C48/80 group,  P < 0.05 and
  P < 0.01 vs. the DSCG group. There were four to six mice per group, and the data were representative of three experiments.

