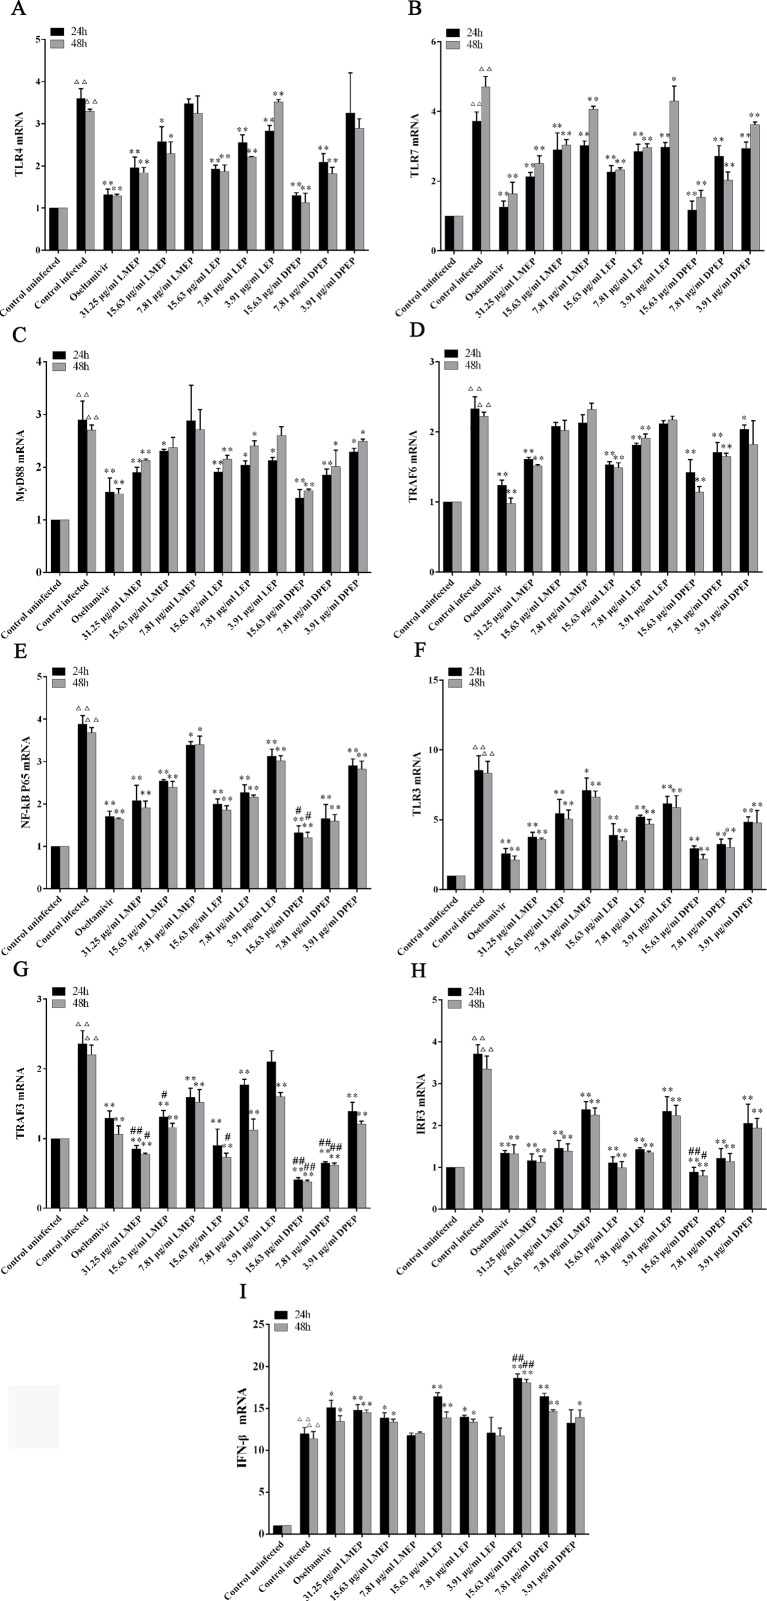
Figure 6.
The expression of mRNA related to TLRs signaling pathway. (A) TLR4; (B) TLR7; (C) MyD88; (D) TRAF6; (E) NF-κB p65; (F) TLR3; (G) TRAF3; (H) IRF3; (I) IFN-β. △△ P < 0.01 vs. the control uninfected group, **P < 0.01 vs. the control infected group, *P < 0.05 vs. the control infected group, ## P < 0.01 vs. oseltamivir group, # P < 0.05 vs. oseltamivir group.

