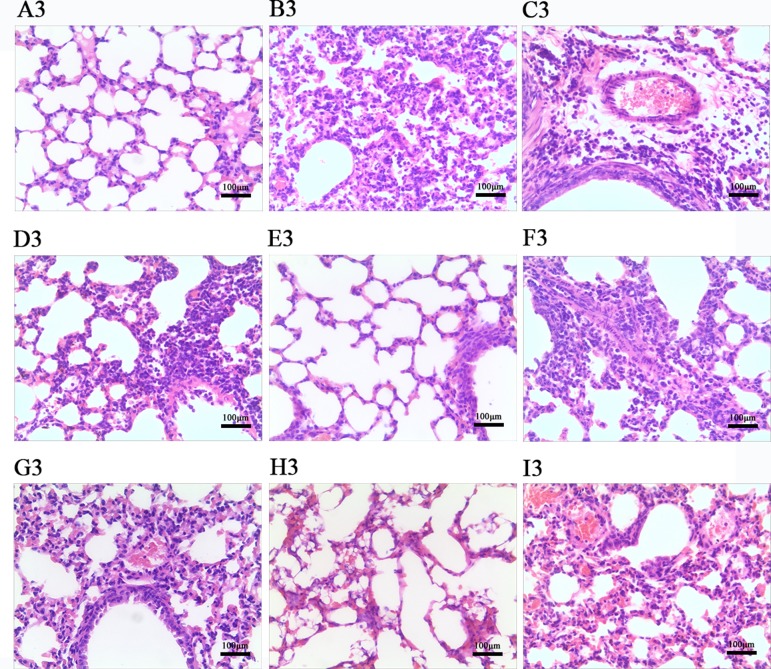
Figure 7.
Photomicrographs of lung tissue morphology of mice at day 3 post-infection with HE staining (magnification, 100×). (A) The control uninfected group; (B) the control infected group; (C) oseltamivir group; (D) LEP 40 mg/kg group; (E) LEP 20 mg/kg group; (F) LEP 10 mg/kg group; (G) DPEP 40 mg/kg group; (H) DPEP 20 mg/kg group; (I) DPEP 10 mg/kg group. The number 3 means the 3rd day post-infection.

