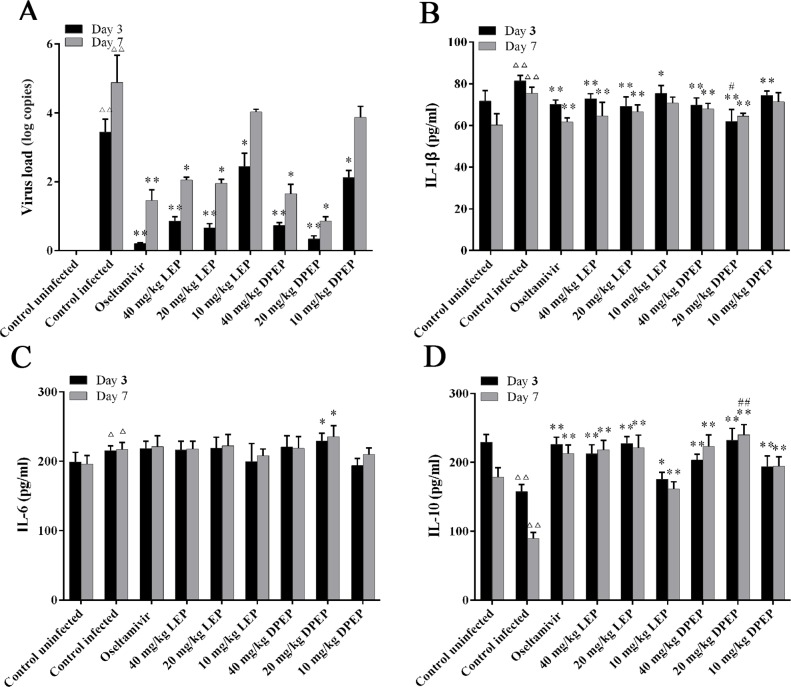
Figure 9.
Virus load (A) and cytokine expression (B–D) in mice following the treatment of LEP and DPEP at days 3 and 7 post-infection. △△ P < 0.01 compared with the control uninfected group, △ P < 0.05 compared with the control uninfected group; **P < 0.01 compared with the control infected group, *P < 0.05 compared with the control infected group; ## P < 0.01 compared with oseltamivir group, # P < 0.05 compared with the oseltamivir group.

