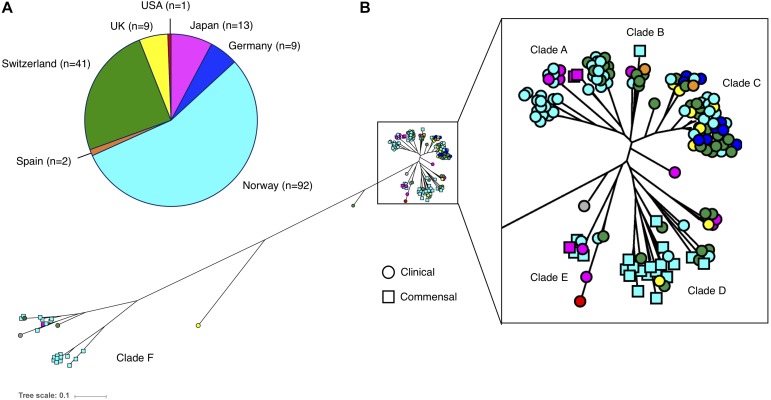
FIGURE 2.
(A) Number and origin of isolates included in this study. (B) Phylogenetic tree of the 169 S. haemolyticus isolates, based on SNPs in the core genome. Each isolate is color coded based on country of origin, as demonstrated in the pie chart. Clinical isolates are displayed as circles and commensal isolates as squares.

