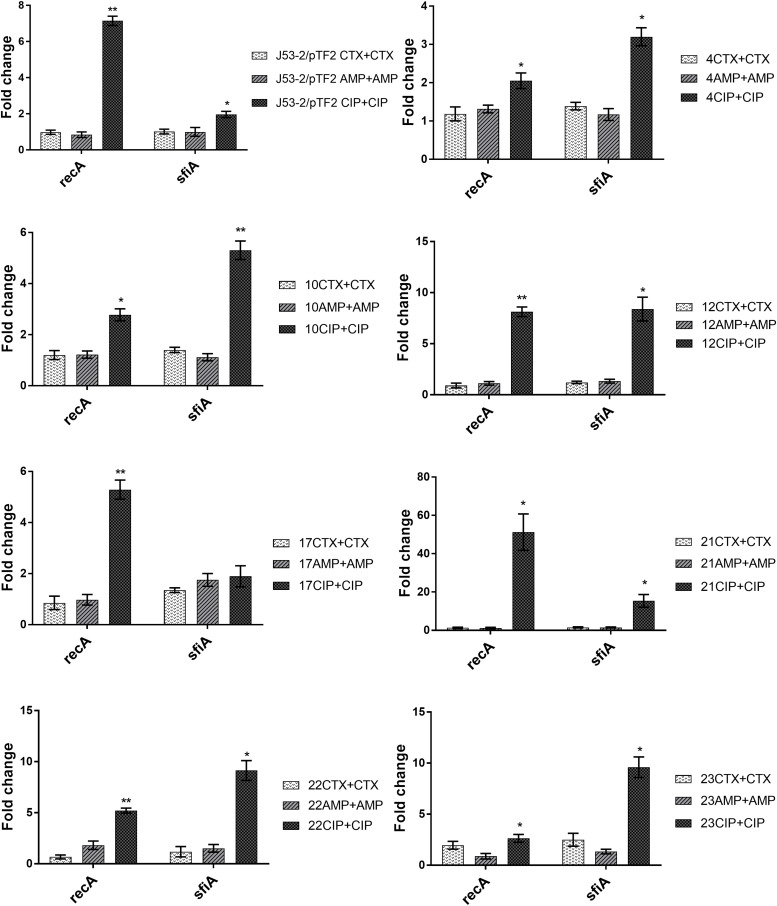
FIGURE 2.
Expression of SOS-responsive genes in the transconjugants from the first round of conjugation. Cell samples grown with no or 1/2 MIC of antibiotics (+CTX, AMP, or CIP) were used for RT-qPCR. Data are presented as fold change relative to control without antibiotics. Note that the different figures are not drawn to the same scale. The combination of strain number with antibiotic name represents the transconjugants from the first round obtained after exposure to the specified antibiotic. The expression data were normalized to two validated reference genes, gapA and nusG. The results shown are means of three biological replicates with two technical replicates each and the error bars represent standard errors of the means. The stars indicate statistical significance at different levels: ∗P ≤ 0.05, ∗∗P ≤ 0.01.

