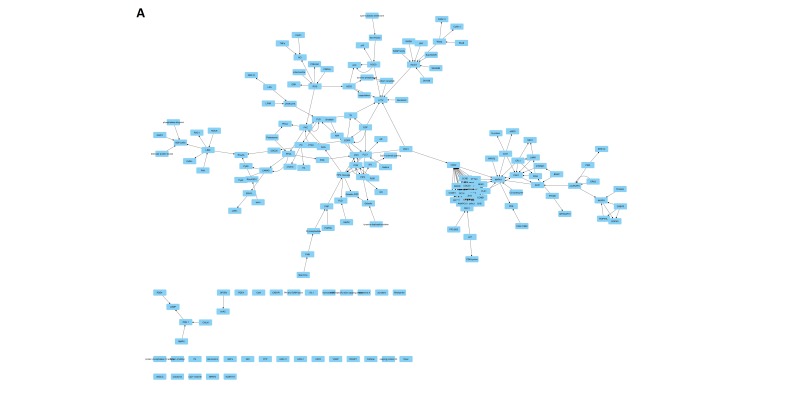
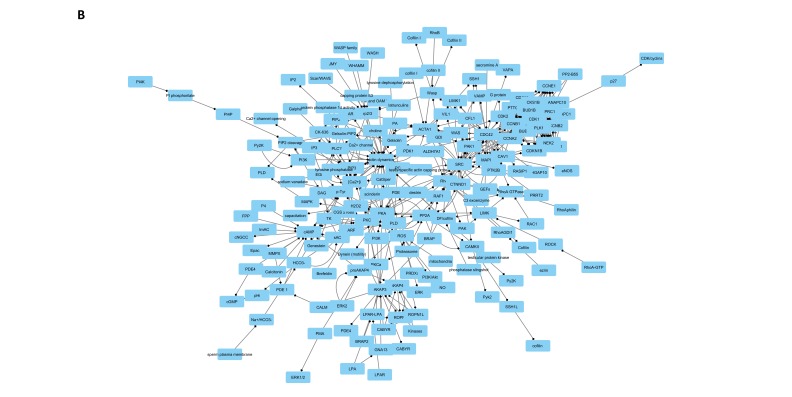
Figure 6.
Diagram showing the effects of the removal from the network of controllers identified by our analysis (target attack), Panel A, compared with the effect of the removal of the same number of randomly selected nodes (random attack), Panel B. As it is evident, in the first case the network collapsed, in the second one no important changes in network topology are evident.


