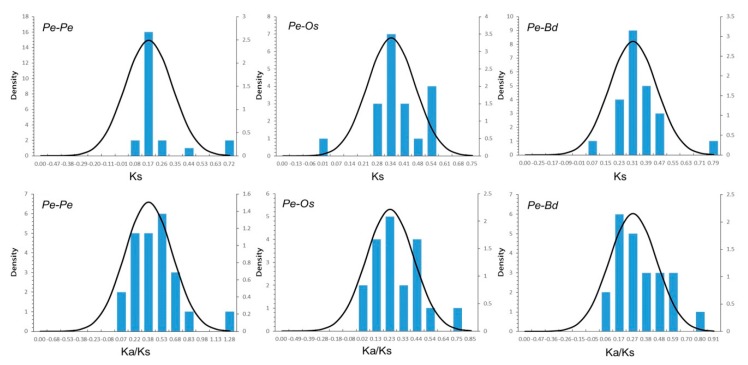
Figure 6.
Ks and Ka/Ks value distributions of the PeUBP genes in the genomes of moso bamboo, rice, and Brachypodium distachyon, viewed through the frequency distribution of relative Ks and Ka/Ks modes. Distributions of Ks and Ka/Ks values were obtained from paralogous gene pairs in the moso bamboo genome, orthologous gene pairs between moso bamboo and rice, and orthologous gene-pairs between moso bamboo and B. distachyon.

