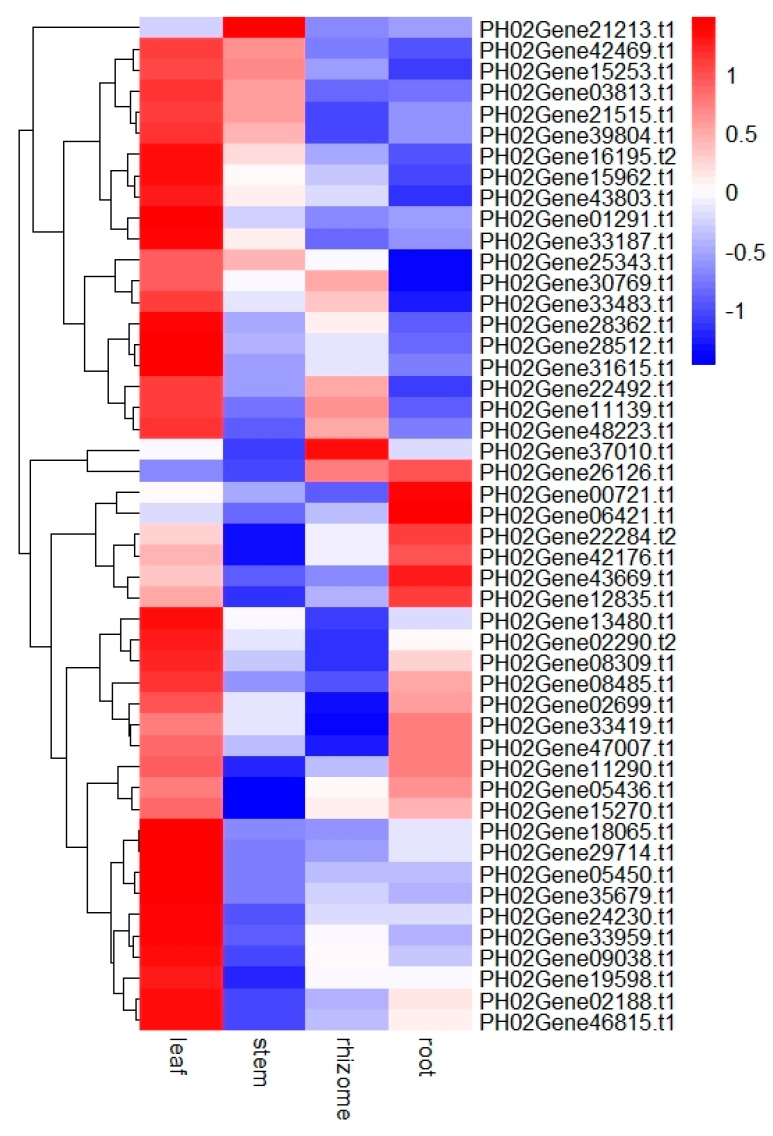
Figure 7.
Expression profiles of PeUBP genes in different tissues of moso bamboo. Samples were from leaf, stem, rhizome, and root. The heatmap shows the hierarchical clustering of 48 PeUBP genes across the different tissues analyzed. The color scale presented vertically at the right side of the picture represents log10 expression values; blue and red represents low and high levels of transcript abundance. The mean values were obtained from three biological and three technical replicates.

