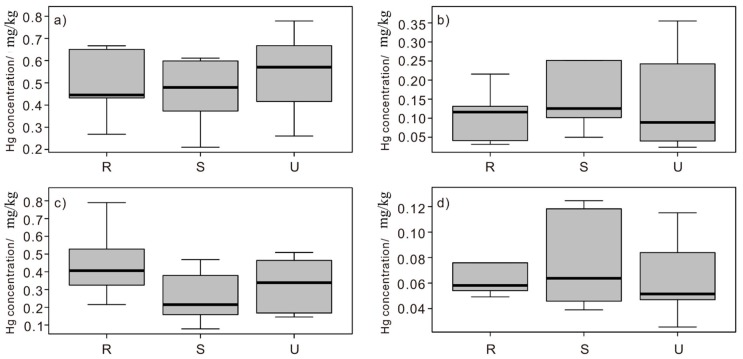
Figure 3.
Comparison of mercury concentrations in different land-use types of four environmental media, (a) road dust, (b) foliar dust, (c) soil, and (d) camphor tree leaves. R: rural area (R1–R9); S: suburban industrial area (S1–S9); U: urban area (U1–U14). The solid lines within boxes show the median values of each group. The upper and lower boundary of the boxes indicates the 25th and 75th percentiles. Horizontal lines represent the maximum and minimum values.

