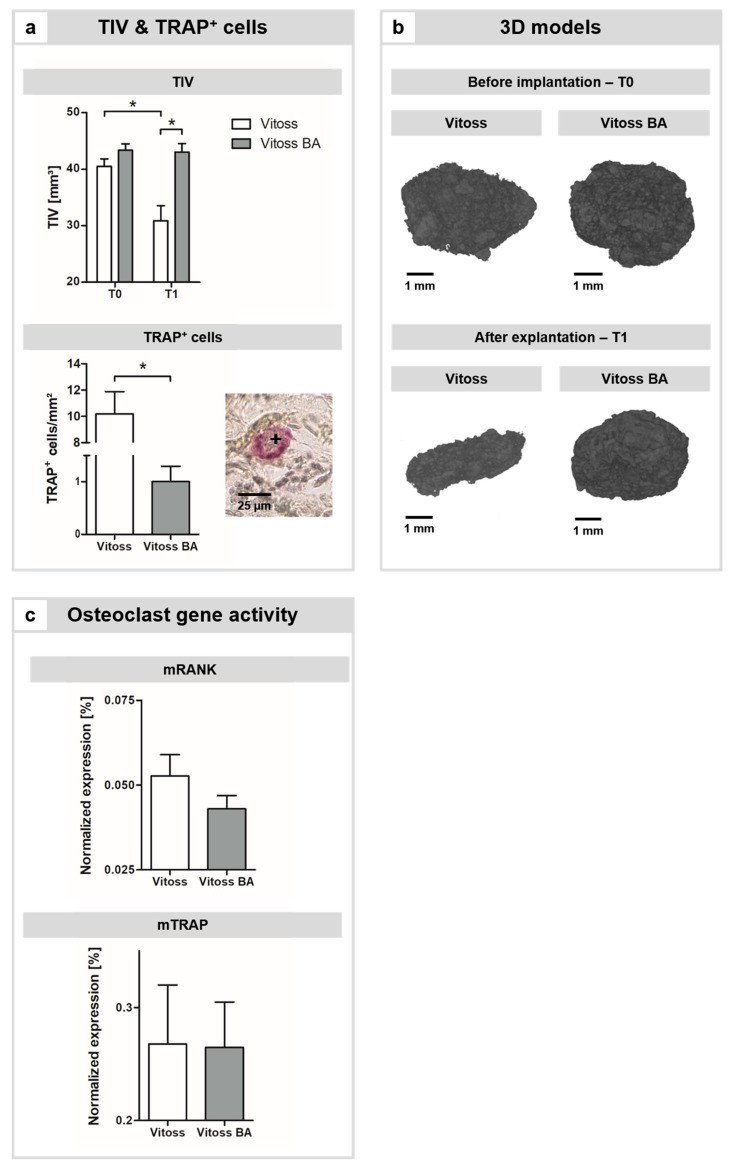
Figure 2.
Impact of BG particles on resorption kinetics. (a) Quantification of the changes in TIV during the incubation period and presence of TRAP+ cells in both scaffold groups. As an example, a TRAP+ cell is shown (a, +), scale bar refers to 25 µm. (b) 3D visualization of the changes in TIV of representative Vitoss and Vitoss BA scaffolds, scale bars refer to 1 mm. (c) Gene activity of osteoclastic marker genes, namely murine receptor activator of nuclear factor κB (mRANK) and murine TRAP (mTRAP). (*) indicates significant differences.

