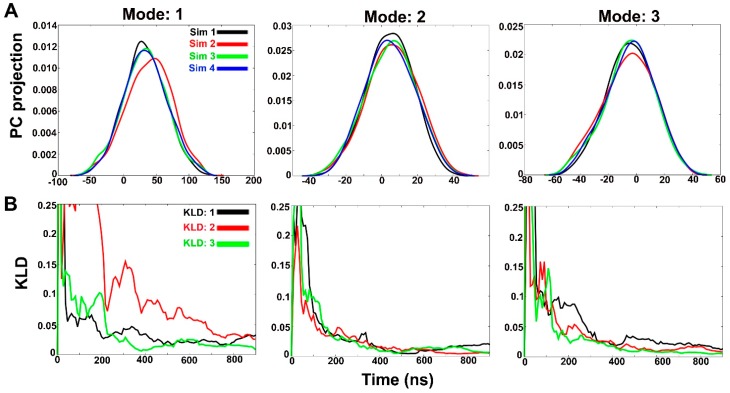
Figure 3.
(A) Histograms of projection of principal components 1, 2 and 3 for all four simulations in water. Histograms were calculated using a Gaussian kernel density estimator. (B) A measure of overlap between histograms from independent simulations calculated using Kullback-Leibler divergence method. The slope values lying below 0.025 indicate convergence between two independent runs.

