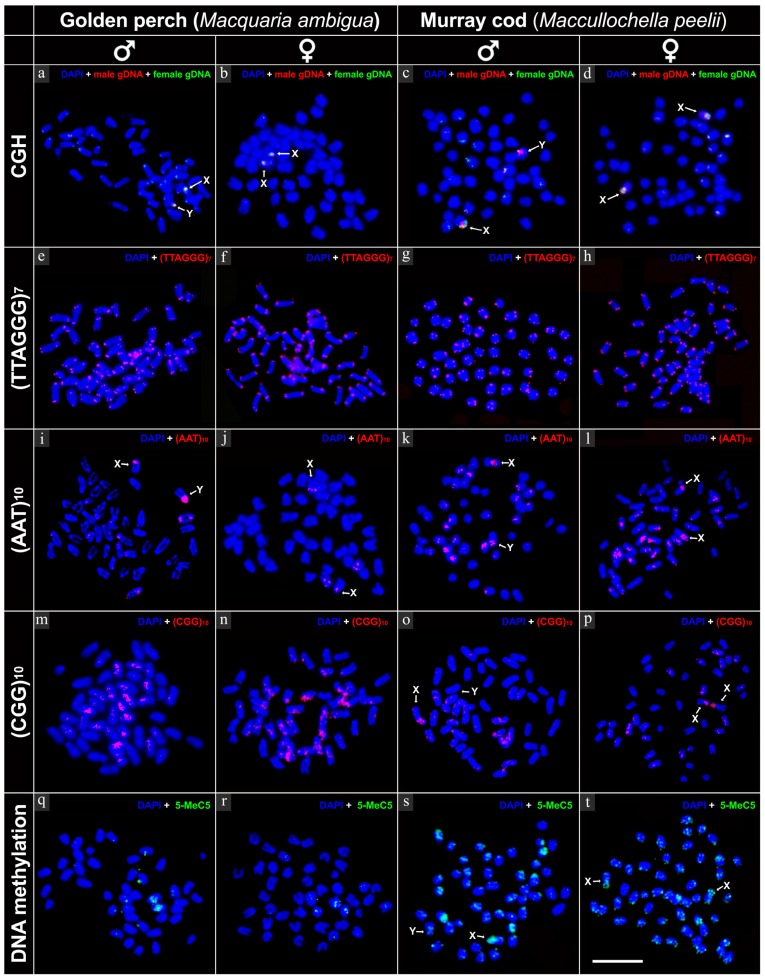
Figure 4.
Fluorescence in situ hybridisation signals of genomic DNA (CGH, a–d), telomeric probe (e–h), microsatellite motifs (i–p) and DNA methylation patterns in golden perch and Murray cod (q–t). CGH (a–d): hybridisation signals for fluorescently labelled genomic DNA of golden perch and Murray cod, showing hybridisation signals on X and Y sex chromosome; TTAGGG7 (e–h): showing terminal hybridisation signals in all chromosomes; AAT10 (i–l): hybridisation pattern of repetitive microsatellite motif (AAT)10, showing abundant accumulation on golden perch Y chromosome; CGG10 (m–p): hybridisation signals from repetitive microsatellite motif (CGG)10, showing high accumulation on X chromosome of Murray cod compared with that of the Y chromosome. DNA methylation (q–t): immunofluorescent detection of DNA methylation, showing hypermethylated X chromosome in Murray cod compared with that of the Y chromosome. Scale bar represent 5 µm.

