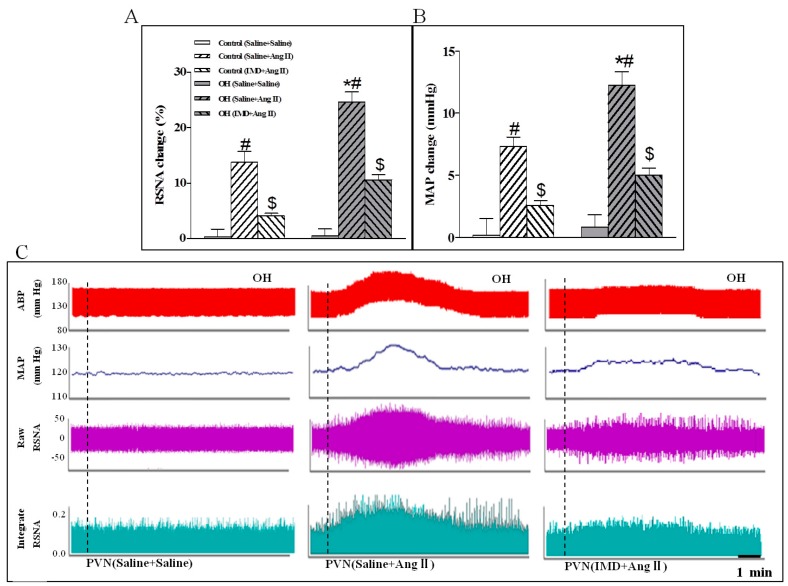
Figure 3.
Statistical analysis (A,B) and representative recordings in OH rats (C) showing the effects of saline or IMD (50 pmol) pretreatment in the PVN on RSNA and MAP responses to Ang II (0.3 nM) in control and OH rats. Ang II was administered 45 min after the pretreatment. Values are mean ± SEM. * p < 0.05 versus control. # p < 0.05 versus saline + saline. $ p < 0.05 versus saline + Ang II. n = 6 for each group.

