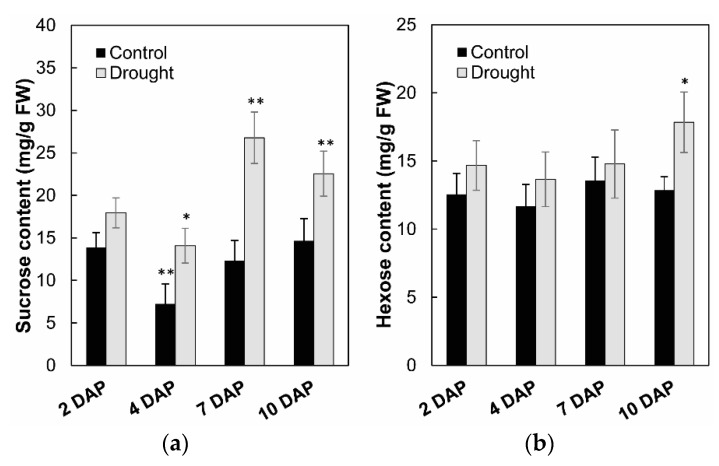
Figure 12.
Effect of drought stress on sucrose content (a) and hexose content (b) in young maize kernels. Data of sugar quantification represents mean ± SE of at least six biological replicates. Asterisks indicate significant differences in comparison with the control using a Student’s t-test: * p < 0.05, ** p < 0.01.

