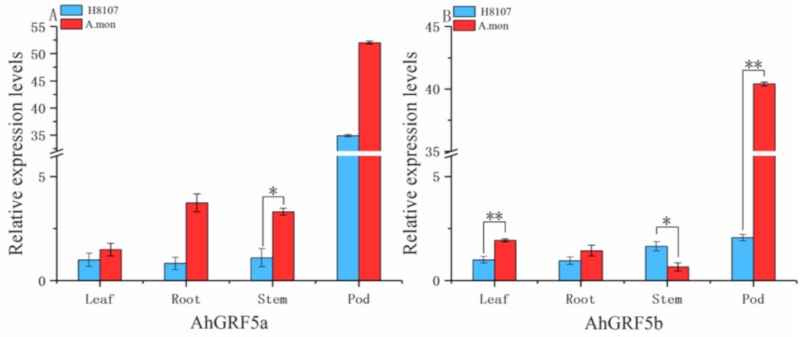
Figure 5.
Expression analysis of AhGRF genes in different tissues. The qRT-PCR analysis of AhGRFs transcript levels was performed on leaves, roots, stems and pods. (A) AhGRF5a and (B) AhGRF5b. Experiments were repeated three times and vertical bars indicate standard errors. * and ** represent significant differences at p < 0.05 and p < 0.01, respectively.

