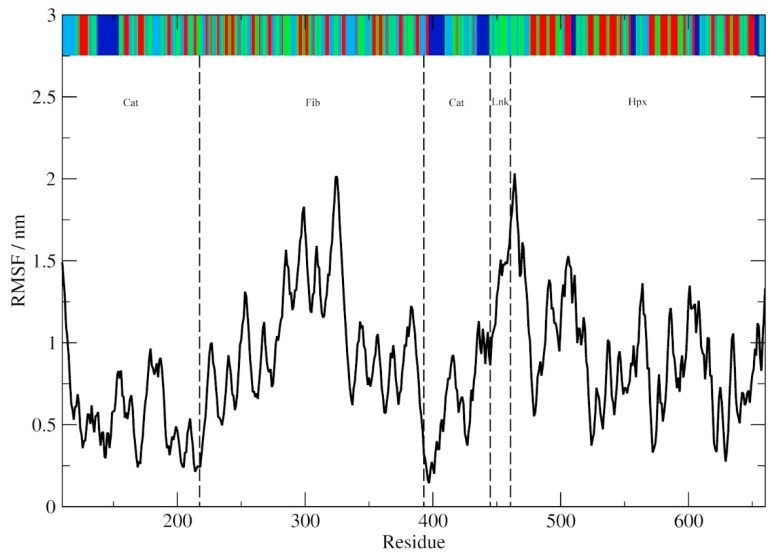
Figure 2.
The Cα-trace root mean square fluctuation (RMSF). The DSSP assigned secondary structure (sampled >50% of the simulation time) is shown at the top of the graph (blue, α-helix; red, β-sheet; green, β-turn/bend; and aqua, coil). The Cat, Fib and Hpx domains and Lnk regions are demarcated with dotted lines.

