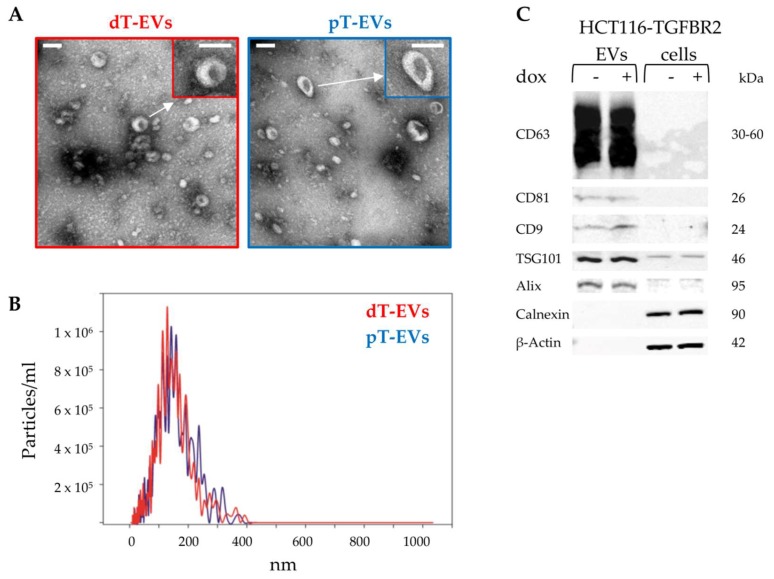
Figure 2.
Identification of EVs. (A) Transmission electron microscopy (TEM) pictures visualized the morphology of isolated EVs. Scale bar: 100 nm. (B) Nanoparticle tracking analysis (NTA) revealed the size distribution and particle concentration of isolated EVs. (C) Western blot analysis confirmed EV-specific and cell-specific protein marker expression. Protein sizes are indicated.

