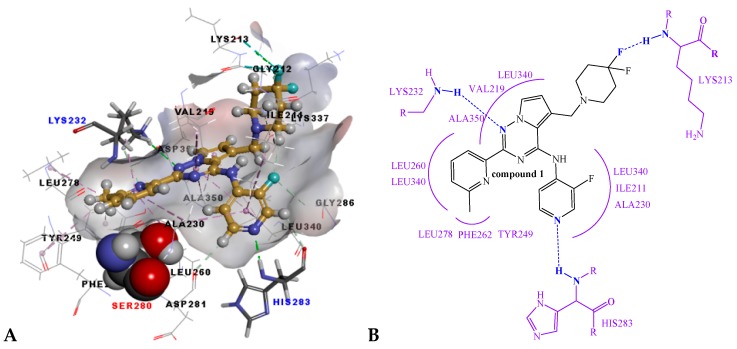
Figure 3.
(A) The interpolated charge receptor surface (amino acid residue SER280 in the Corey-Pauling-Koltun model, amino acid residue LYS232 and HIS283 in the stick model, other amino acid residues in the line model and Compound 1 in the ball and stick model; the receptor surface colored by the interpolated atomic charge—blue represents a positive value and red represents a negative value); (B) the ligand–receptor interactions of Compound 1 shown as a 2D diagram—blue dotted lines represent hydrogen bindings and purple curved lines represent the frontiers of amino acid residues binding to Compound 1.

