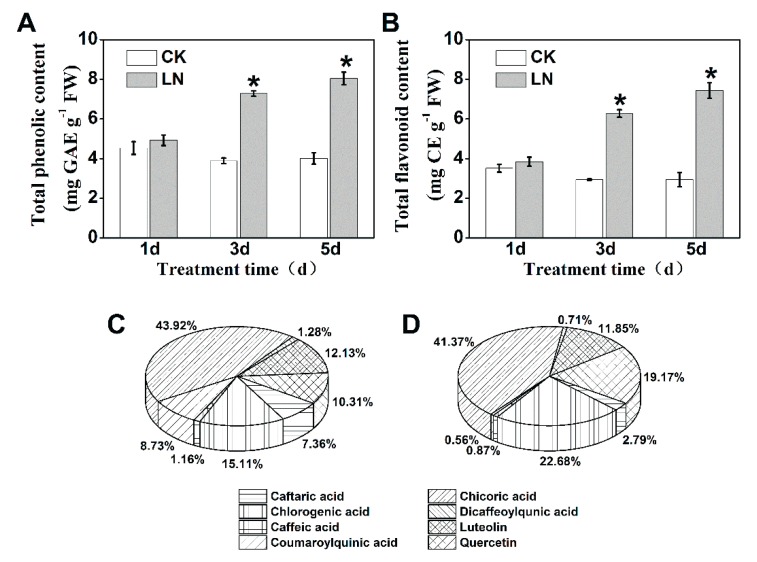
Figure 1.
(A) Total phenolic content and (B) flavonoid content in lettuce cultivated under adequate (CK) or low nitrogen solution (LN). The percentage contribution of individual phenolic compounds to the total phenolics in lettuce extracts after 5 days of CK (C) or LN treatment (D). Data represent means ± SD (n = 6). * indicates significant difference at P < 0.05 between LN and CK.

