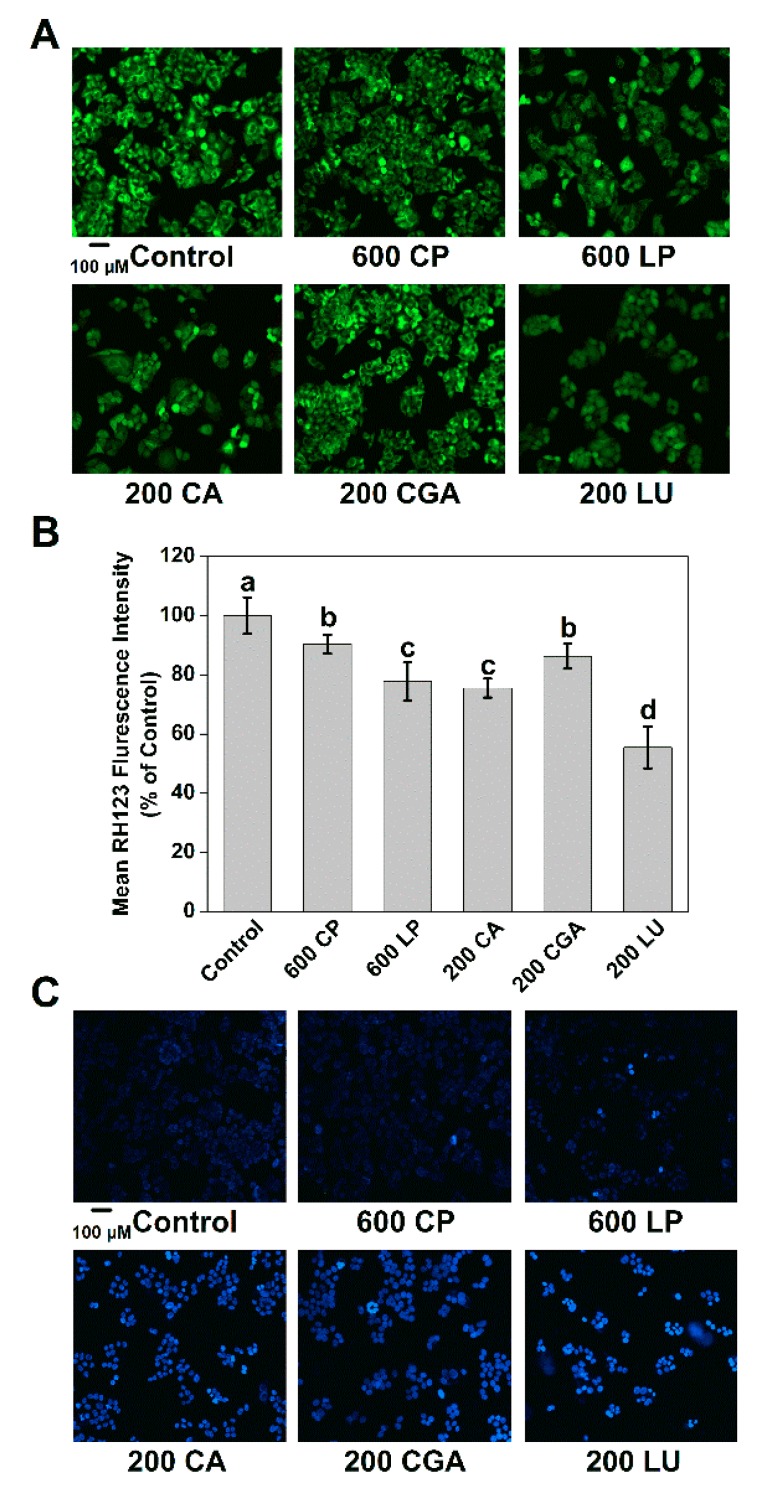
Figure 4.
Effects of lettuce extracts and pure individual phenolic compounds on mitochondrial membrane potential and DNA damage in Caco-2 cells. (A) The mitochondrial membrane potential determined by fluorescence microscopy after incubation with RH 123. (B) The quantitative data of mean RH 123 fluorescence intensity. (C) Nuclear staining of Caco-2 cells with Hoechst 33258. Different letters indicate significant difference at P < 0.05.

