Figure 3.
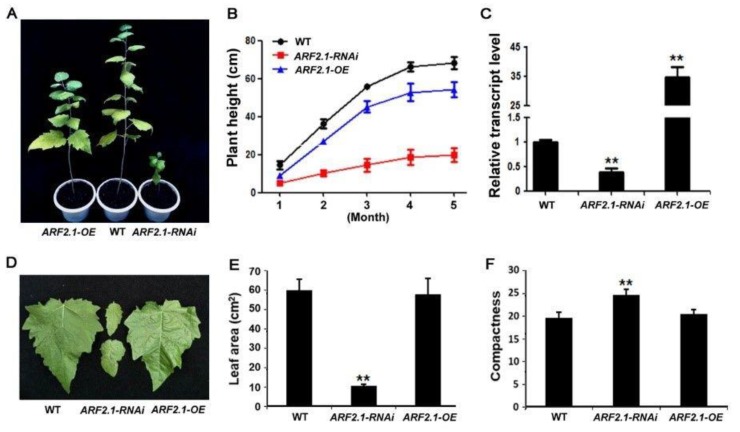
Phenotype analysis of PtrARF2.1 overexpressed and suppressed poplars. (A) Representative five-month-old PtrARF2.1-OEand PtrARF2.1-RNAi plants compared with the wildtype (WT). (B) Comparison of plant height in WT, PtrARF2.1-OEand PtrARF2.1-RNAi plants. Measurements were made for 30 plants of each line during five months of plant growth in the greenhouse. Error bars mean ± SD value for each line. (C) Quantitative RT-PCR analysis of PtrARF2.1 transcripts in representative PtrARF2.1-RNAi and PtrARF2.1-OE lines. The poplar 18S rRNA was used as an internal control. Error bars mean ± SD of three biological replicates. (D) Representative 5-month-old leaf phenotypes from PtrARF2.1-RNAi and PtrARF2.1-OE lines in comparison with the WT control. (E) Comparison of the leaf area in PtrARF2.1-RNAi, PtrARF2.1-OE and WT plants. Error bars mean ± SD of three biological replicates. (F) Quantitative analysis of the leaf index value of compactness from PtrARF2.1-RNAi, PtrARF2.1-OE and WT plants. Error bars mean ± SD of three biological replicates. Stars indicate the statistical significance using Student’s t-test: ** p-value < 0.01.

