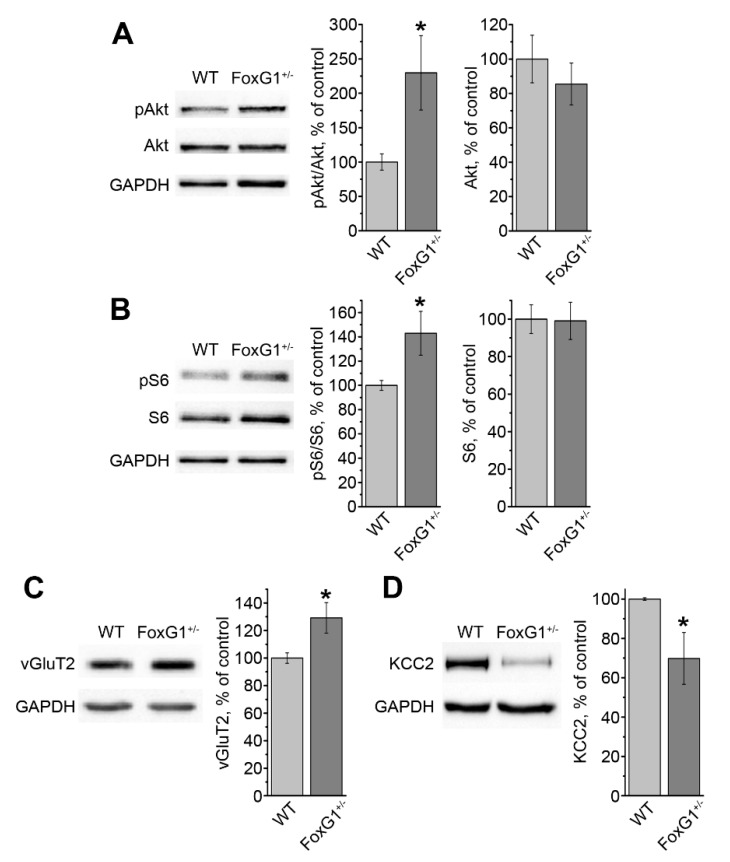
Figure 2.
Hyperactivation of the Akt/S6 pathway and dysregulation in the excitatory/inhibitory balance in the cortex of FoxG1+/− mice. (A) Representative blots and quantifications showing higher Akt phosphorylation in FoxG1+/− mice compared to wild type controls (WT) (WT, n = 5; FoxG1+/−, n = 5; Student’s t-test, * p ≤ 0.05); (B) representative blots and quantification showing higher S6 phosphorylation in FoxG1+/− mice compared to wild type controls (WT) (WT, n = 5; FoxG1+/−, n = 5; Student’s t-test, * p ≤ 0.05); (C) representative blots and quantification showing higher vGluT2 expression in FoxG1+/− mice compared to wild type controls (WT) (WT, n = 5; FoxG1+/−, n = 5; Student’s t-test, * p ≤ 0.05); (D) representative blots and quantification showing lower KCC2 expression in FoxG1+/− mice compared to wild type controls (WT) (WT, n = 5; FoxG1+/−, n = 5; Student’s t-test, * p ≤ 0.05).

