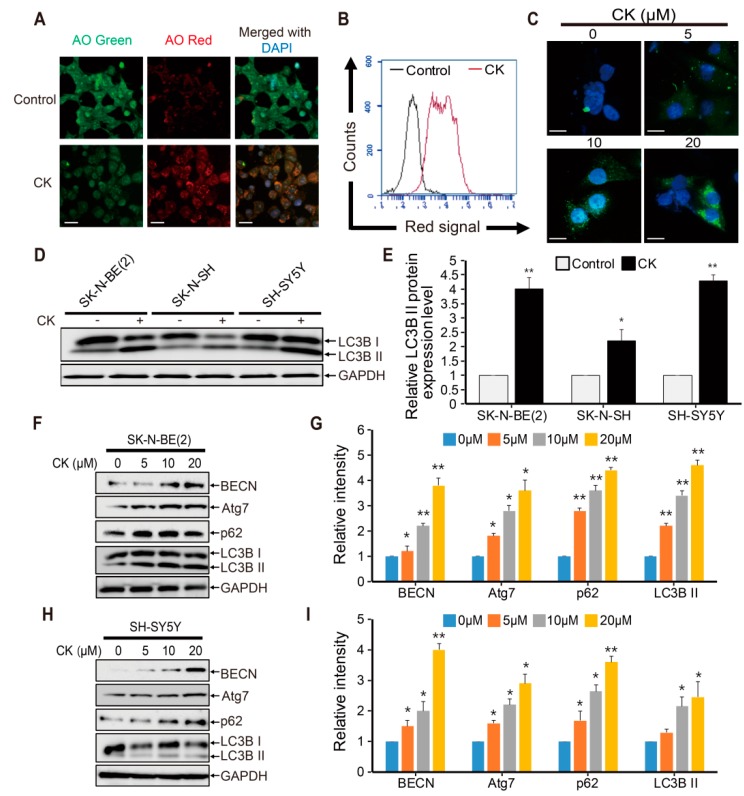
Figure 5.
CK treatment promotes early stage autophagy but blocks autophagic flux. (A) Acidic vesicular organelles (AVOs) were examined by incubating SK-N-BE(2) cells treated with or without CK in 10 μM acridine orange (AO) for 30 min, and images were captured using a fluorescence microscopy. (B) AVO-positive SK-N-BE(2) cells were quantified by flow cytometry. Results shown are representative of three independent experiments. (C) pEGFP-LC3B transfected stable SK-N-BE(2) cells were treated with different concentrations of CK for 12 h, and images showing LC3-GFP puncta and accumulation of autophagosomes were visualized under a florescence microscope. CK treatment increases GFP-LC3 punctuation. Scale bar: 50 μm. (D) The LC3B expression level was measured by western blot in SK-N-BE(2), SK-N-SH, and SH-SY5Y cells treated with 5 μM of CK for 24 h. (E) The relative LC3B II protein expression level was significantly increased by CK treatment in all three neuroblastoma cell lines. (F–I) Cells were treated with various concentrations of CK for 24h in SK-N-BE(2) and SH-SY5Y cells. Western blotting was performed with antibodies specific for BECN, Atg7, p62, LC3B, and GAPDH in SK-N-BE(2) cells (F) and SH-SY5Y cells (H). Relative protein expression levels were shown in the histogram (G,I), and band intensities were quantified using the Image J program. All bar graph data (E,G,I) are shown as mean ± SD in three independent experiments. *: p < 0.05 versus control and **: p < 0.01 versus control.

