Figure 7.
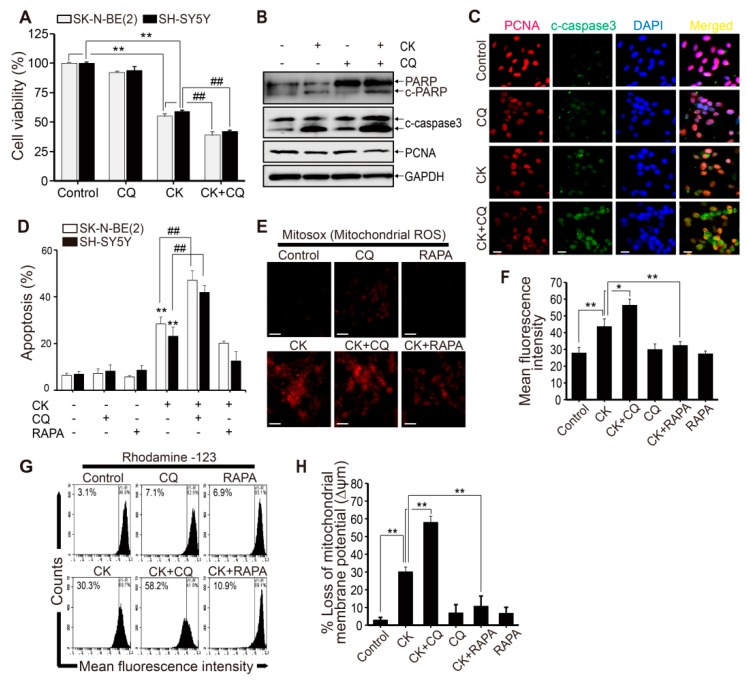
Inhibition of autophagy promotes CK-induced apoptosis via mitochondrial membrane ROS and mitochondrial membrane potential loss in human neuroblastoma cells. (A–D) Cells were pretreated with 10 μM CQ for 3 h prior to the treatment with CK 5 μM for 24 h. (A) SK-N-BE(2) and SH-SY5Y cell viability was determined by CCK-8 assay after 24 h incubation. (B) The protein levels of PARP, cleaved caspase-3, and PCNA in SK-N-BE(2) cells were analyzed by western blot. (C) Immunostaining was performed with cleaved caspase-3 and PCNA antibodies in SK-N-BE(2) cells. (D) Apoptotic cell death was evaluated by Annexin V/PI analysis with flow cytometry in SK-N-BE(2) and SH-SY5Y cells. Data (A) and (D) are presented as mean ± SD. **: p < 0.01 versus control cells, and ##: p < 0.01 versus CK-treated cells. (E,F) SK-N-BE(2) cells were treated with 5 μM CK with or without CQ (10 µM) or rapamycin (RAPA) (100 nM) for 24 h. (E) The MitoSOX™ Red fluorescence intensity was detected by fluorescence microscopy. (F) The corresponding histograms were quantified by Image J. All data are represented as mean ± SD (N = 3) for each group. *: p < 0.05, **: p < 0.01. (G) To determine mitochondrial membrane depolarization, SK-N-BE(2) cells stained with Rhodamine123 dyes were analyzed by flow cytometry. (H) Data are presented as mean ± SD (n = 3) for each group. **: p < 0.01. CK, Ginsenoside compound K; CQ, chloroquine.

