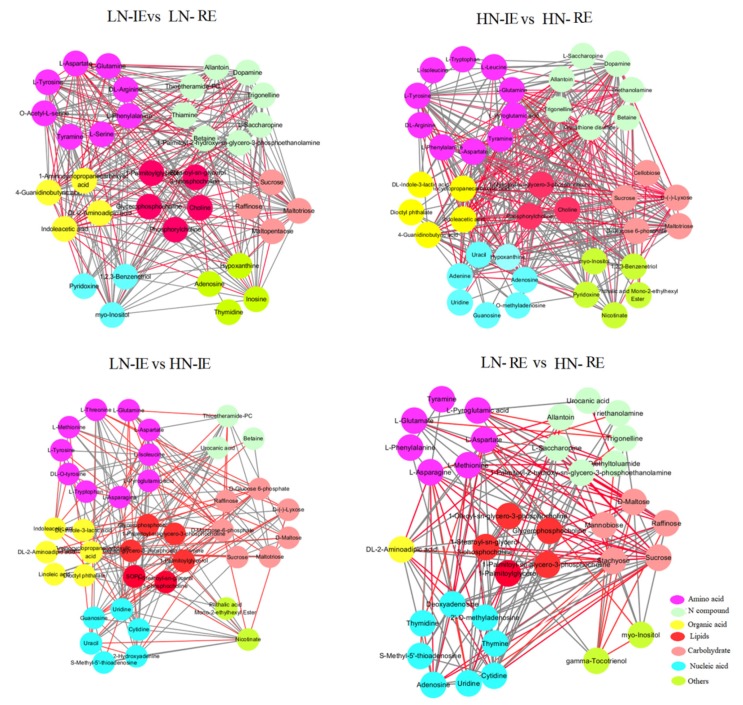
Figure 6.
Network of metabolite-metabolite correlation based on significant correlations. Nodes stand for metabolites and edges stand for metabolite relationship. Red edges mean negative correlation, and grey edges mean positive correlation. The nodes in different color mean different metabolite type. HN-IE and HN-RE are samples from innermost endosperm region and the remaining endosperm region under high nitrogen treatment, respectively. LN-IE and LN-RE are samples from innermost endosperm region and the remaining endosperm region under low nitrogen treatment, respectively.

