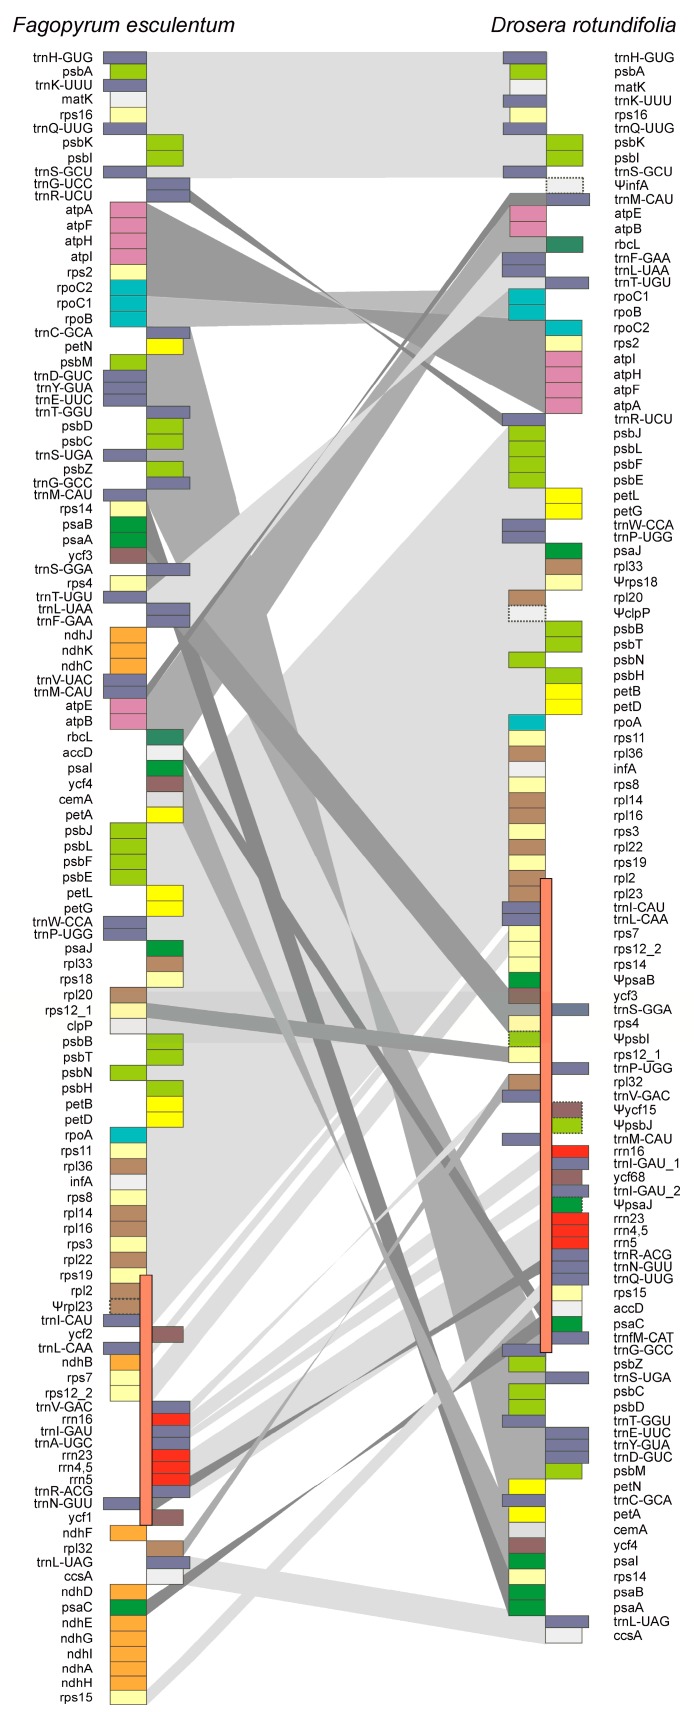
Figure 1.
Schematic gene order comparison map between the plastid genomes of D. rotundifolia and F. esculentum. The linear representation of the circular mapping genomes using trnH-GUG genes as the starting point does not reflect the actual gene size or spacing between the coding regions. The inverted repeat is indicated by an orange rectangle on the main line; only one copy is shown. Boxes represent protein-encoding and RNA genes; genes transcribed in opposite directions are shown to the left and to the right of the main line. The gray areas between the genes highlight the relative locations of identical genes. Ψ denotes pseudogenes.

