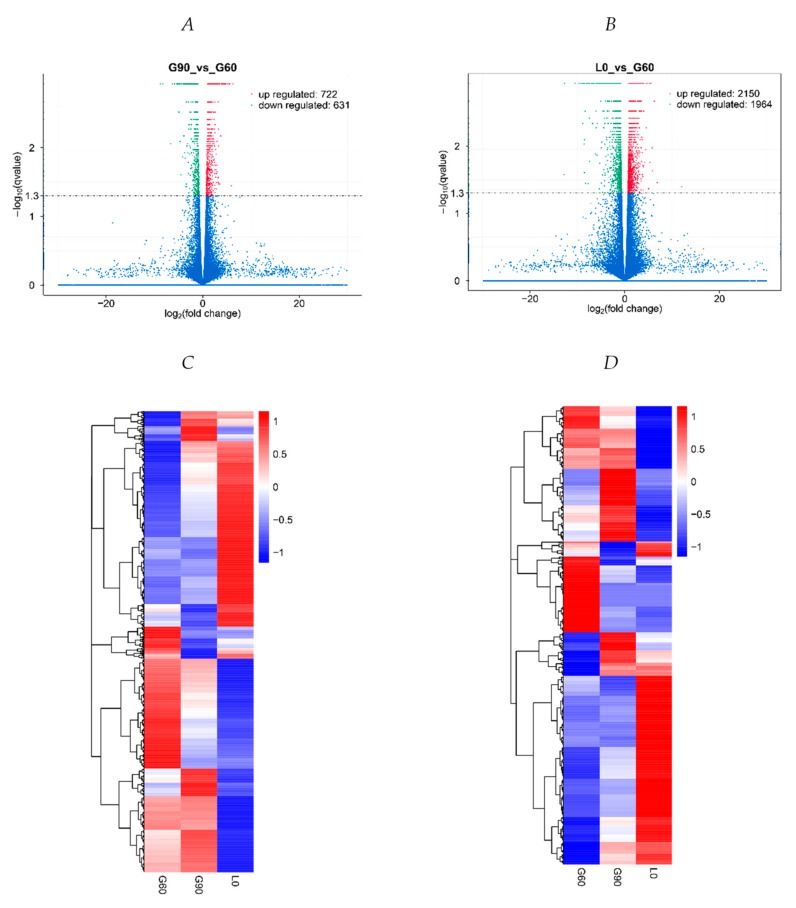
Figure 3.
Transcriptome profile of RNA-seq data at G60, G90, and L0. (A) A volcano plot of differentially expressed transcripts, including mRNAs and long non-coding RNAs (lncRNAs), between G60 and G90, and (B) between G60 and L0. (C) Unsupervised hierarchical clustering of the expression profile of significant genes of mRNAs, and (D) lncRNAs among G60, G90, and L0.

