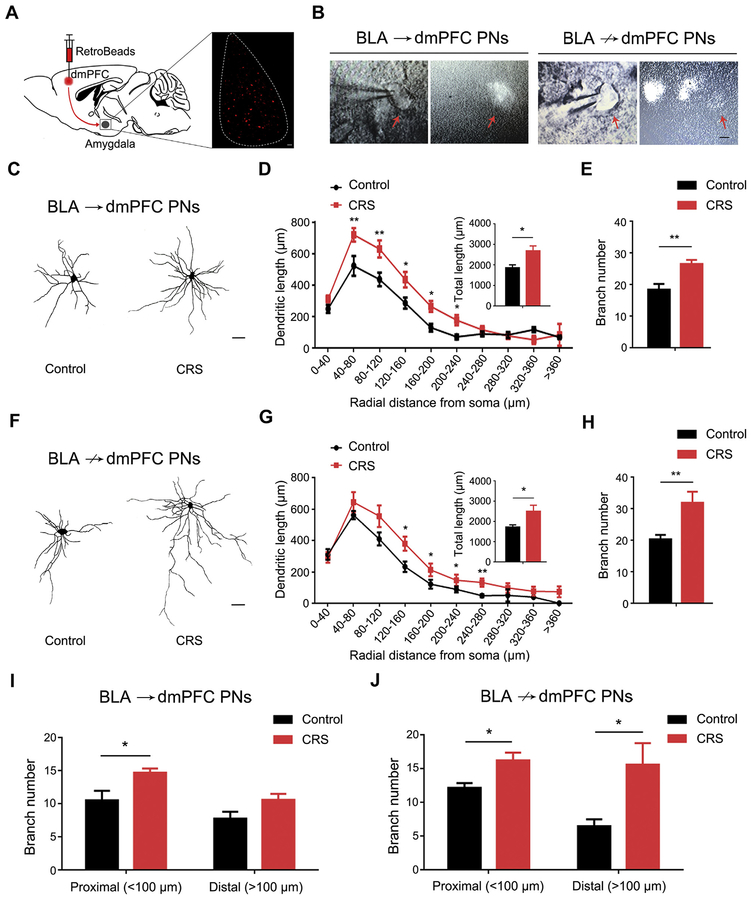
Figure 1.
Chronic restraint stress (CRS) causes dendritic hypertrophy in basolateral amygdala (BLA) projection neurons (PNs) targeting dorsomedial pre-frontal cortex (dmPFC) (BLA→dmPFC) and not targeting dmPFC (BLA↛dmPFC). (A) Schematic showing injection of red fluorescent RetroBeads into dmPFC to label BLA→dmPFC PNs in the BLA. (B) Examples of RetroBead-labeled BLA→dmPFC and BLA↛dmPFC PNs filled with biocytin using patch clamp recording under whole-cell configuration (scale bar = 10 μm). (C) Examples of reconstructed BLA→dmPFC PNs from unstressed control mice and CRS-exposed mice (scale bar = 30 μm). (D) Sholl analysis of dendritic length as a function of distance from the soma in BLA→dmPFC PNs. Averaged total dendritic length (inset). Distance × CRS two-way analysis of variance (ANOVA): interaction (F9,152 = 1.77, p = .079), main effect of distance (F9,152 = 45.14, p < .001), main effect of CRS (F1,152 = 13.60, p < .001). t test: *p < .05, **p < .01, n = 9 neurons/5 control mice, n = 12 neurons/6 CRS-exposed mice. (E) Average dendritic branch number in BLA→dmPFC PNs. t test: **p < .01. (F) Examples of reconstructed BLA↛dmPFC PNs from unstressed control mice and CRS-exposed mice (scale bar = 30 μm). (G) Sholl analysis of dendritic length as a function of its distance from the soma in BLA↛dmPFC PNs. Averaged total dendritic length (inset). Distance 3 CRS two-way ANOVA: interaction (F8,99 = 0.803, p = .602), main effect of distance (F8,99 = 36.91, p < .001), main effect of CRS (F1,99 = 9.65, p = .003). t test: *p < .05, **p < .01, n = 8 neurons/5 control mice, n = 8 neurons/5 CRS-exposed mice. (H) Average dendritic branch number in BLA↛dmPFC PNs. t test: **p < .01. (I, J) Average branch number in proximal and distal dendrites of BLA→dmPFC (I) and BLA↛dmPFC (J) PNs. For BLA→dmPFC PNs, distance 3 CRS two-way ANOVA: interaction (F1,36 = 0.426, p = .518), main effect of distance (F1,36 = 11.66, p = .002), main effect of CRS (F1,36 = 12.21, p = .001). t test: *p < .05. For BLA↛dmPFC PNs, distance 3 CRS two-way ANOVA: interaction (F1,24 = 1.52, p = .229), main effect of distance (F1,24 = 2.37, p = .137), main effect of CRS (F1,24 = 10.44, p = .004). t test: *p < .05. Data are means ± SEM.

