Figure 1:

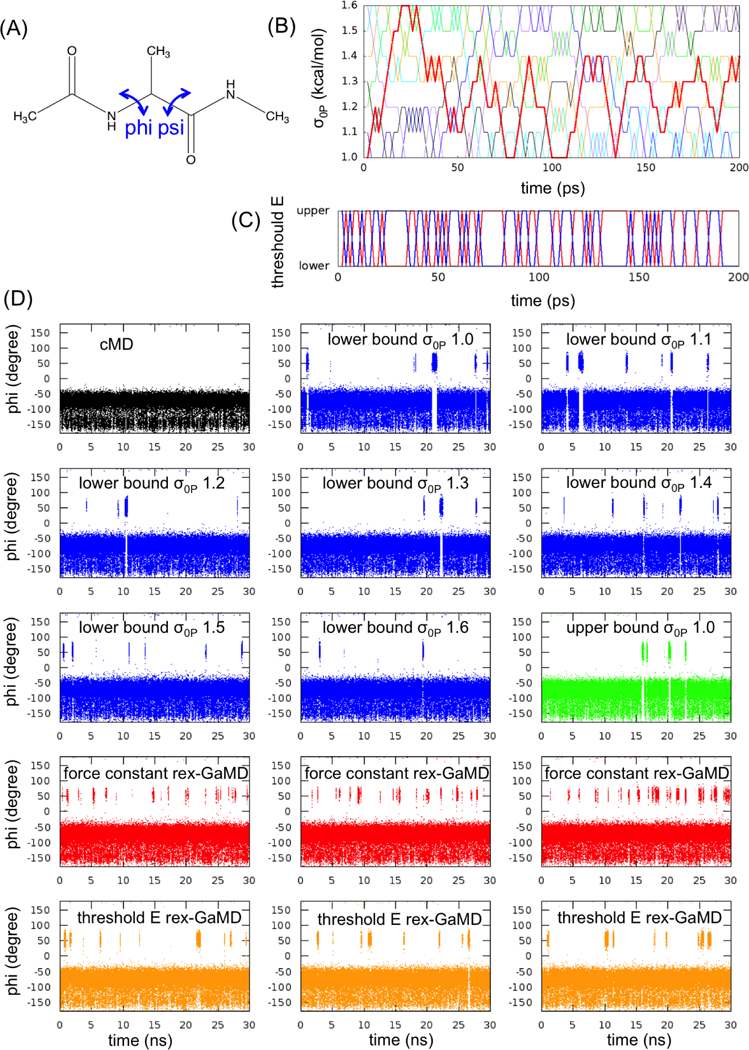
GaMD simulations of alanine dipeptide. (A) Scheme representation of backbone dihedrals, phi and psi, in alanine dipeptide. (B) The changes of σ0P value at each replica during the first 200-ps rex-GaMD simulation of alanine dipeptide. Red, blue, green, black, orange, cyan and violet indicate the replica starting from σ0P = 1.0, 1.1, 1.2, 1.3, 1.4, 1.5 and 1.6 kcal/mol, respectively. (C) The changes of threshold energy during the first 200-ps rex-GaMD simulation. Red and blue indicate the replica starting from lower and upper bound, respectively. (D) The changes of phi dihedral angle of alanine dipeptide in 30-ns GaMD simulations. Black shows the changes of phi dihedral from a cMD simulation. Blue and green show the results from conventional GaMD simulations with various σ0P values at lower and upper bound. Red and orange show the results collected from three independent rex-GaMD simulations with the replica exchange of σ0P and threshold energy. The phi values were calculated from the force constant and threshold energy rex-GaMD simulations using trajectories with σ0P = 1.0 kcal/mol and lower bound threshold energy, respectively.
