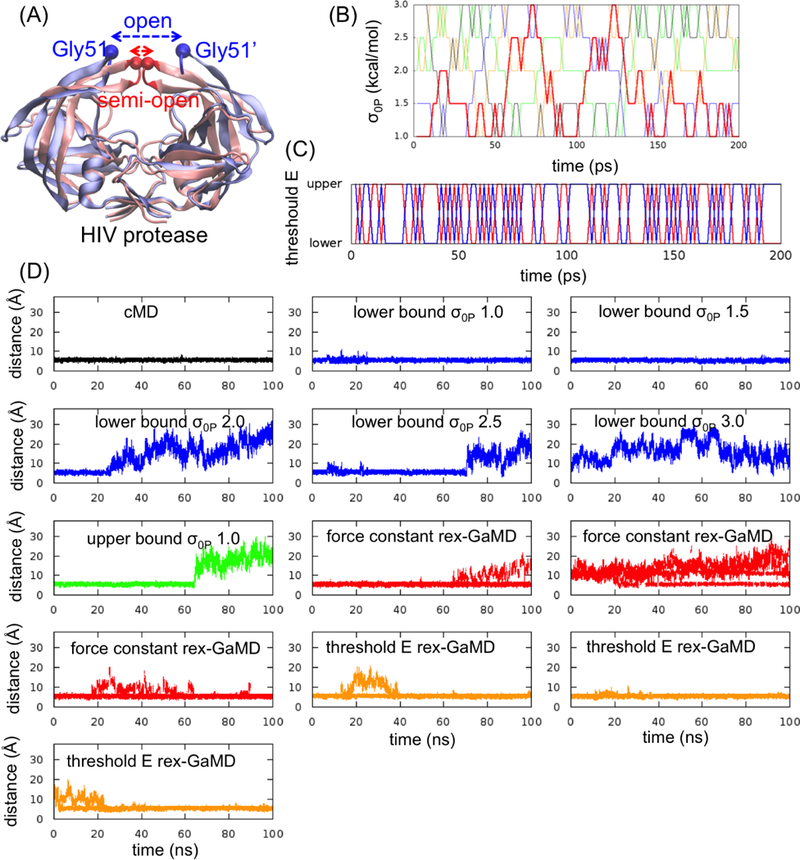
Figure 3:

GaMD simulations of HIV protease. (A) The apo HIV protease has two major conformations, semi-open (red) and open (blue) state. To evaluate the flap opening, the atom distance between Gly51 and Gly51’ and the RMSD of flap tips (highlighted in red and blue) were computed. (B) The changes of σ0P value at each replica during the first 200-ps rex-GaMD simulation of HIV protease. Red, blue, green, orange and black indicate the replica starting from σ0P = 1.0, 1.5, 2.0, 2.5 and 3.0 kcal/mol, respectively. (C) The changes of threshold energy during the first 200-ps rex-GaMD simulation. Red and blue indicate the replica starting from lower and upper bound, respectively. (D) The changes of flap distance of HIV protease in 100-ns GaMD simulations. Black shows the flap distance from a cMD simulation. Blue and green show the distance from conventional GaMD simulations with various σ0P values at lower and upper bound. Red and orange show the results collected from three independent rex-GaMD simulations with the replica exchange of σ0P and threshold energy. The distance values were calculated from the force constant and threshold energy rex-GaMD simulations using trajectories with σ0P = 1.0 kcal/mol and lower bound threshold energy, respectively.
