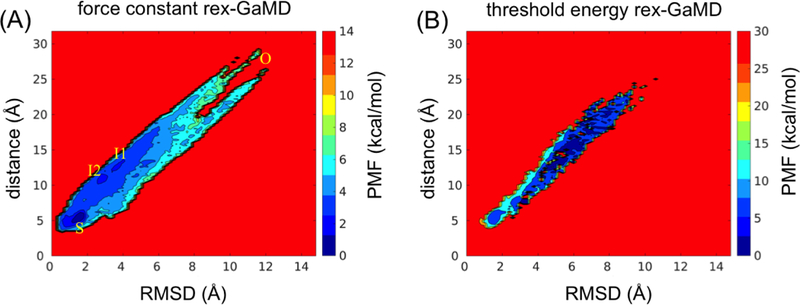
Figure 6:

The 2D PMF plot of flap RMSD and distance of HIV protease. The trajectories at σ0P = 1.0 kcal/mol of three 100-ns rex-GaMD simulations were collected to calculate the PMF using cumulant expansion to the second order. (A) and (B) indicate the results from σ0P and threshold energy rex-GaMD simulations, respectively. The letter ‘O’ and ‘S’ indicate the flaps at open and semi-open state. The two intermediate states are labeled as ‘I1’ and ‘I2’.
