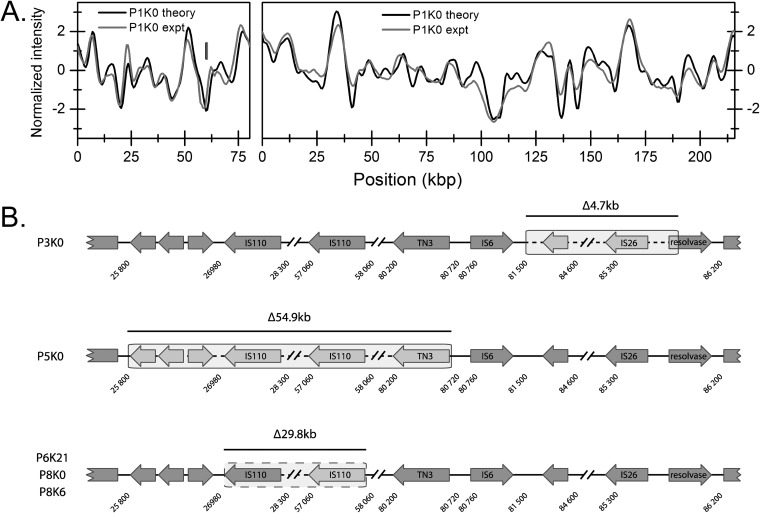
FIG 4.
(A) Comparison of experimental optical map (gray) and theoretical optical map created from PacBio sequencing (black) for the two plasmids in P1K0. The vertical lines mark the locations of the blaCTX-M-15 gene experimentally determined (gray) and predicted from the theoretical sequence (black). (B) Illustration of the positions of deletions in several ESBL-KP isolates. The shaded boxed areas indicate the extension of the deletions.

